

What is SGIS Plus?
○ SGIS Plus is a location-based open service platform that integrates and links census data Ministry of Data and Statistics produces—such as population, households, housing, and establishments—with both public and private sector data.
○ Users can search a wide range of statistical information on a map-based interface (Interactive Statistical Map), explore key social issues through statistical maps by topic (Thematic Maps), and utilize platform-based services (Industry Statistics Maps). In addition, Open APIs are provided to help users to control
maps and to utilize data.
○ Users can integrate their personal data with SGIS Plus for customized data analysis.
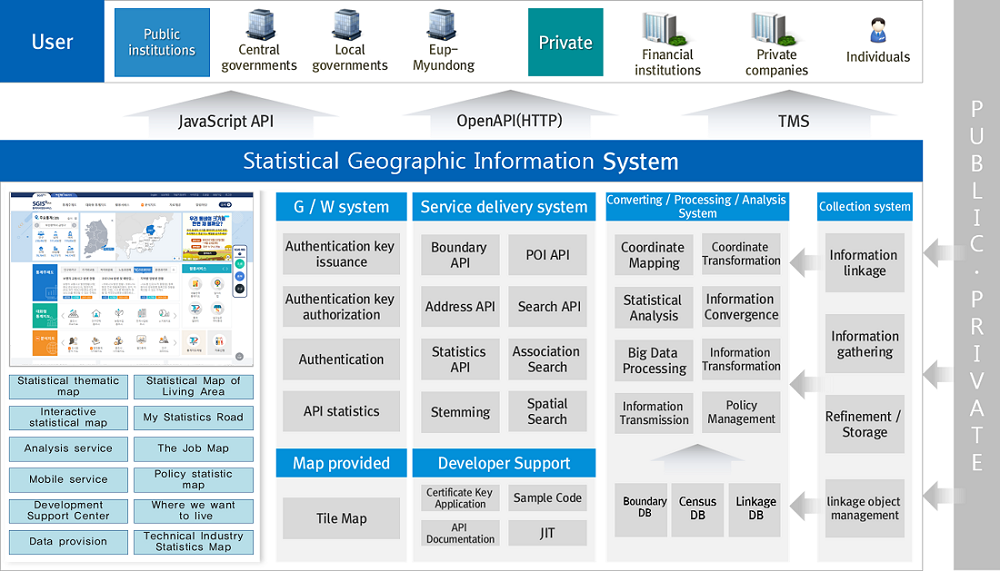
○ System architecture
Content Composition
○ Korean-version SGIS Plus mainly consists of ‘Thematic Maps’, ‘Interactive Statistical Map’, ‘Applications’, ‘Analysis Map’, ‘Data Provision’, ‘Notice’, ’Development Support
Center’ and ’SGIS Education’.
○ Users can access ‘My Page’ after logging in.
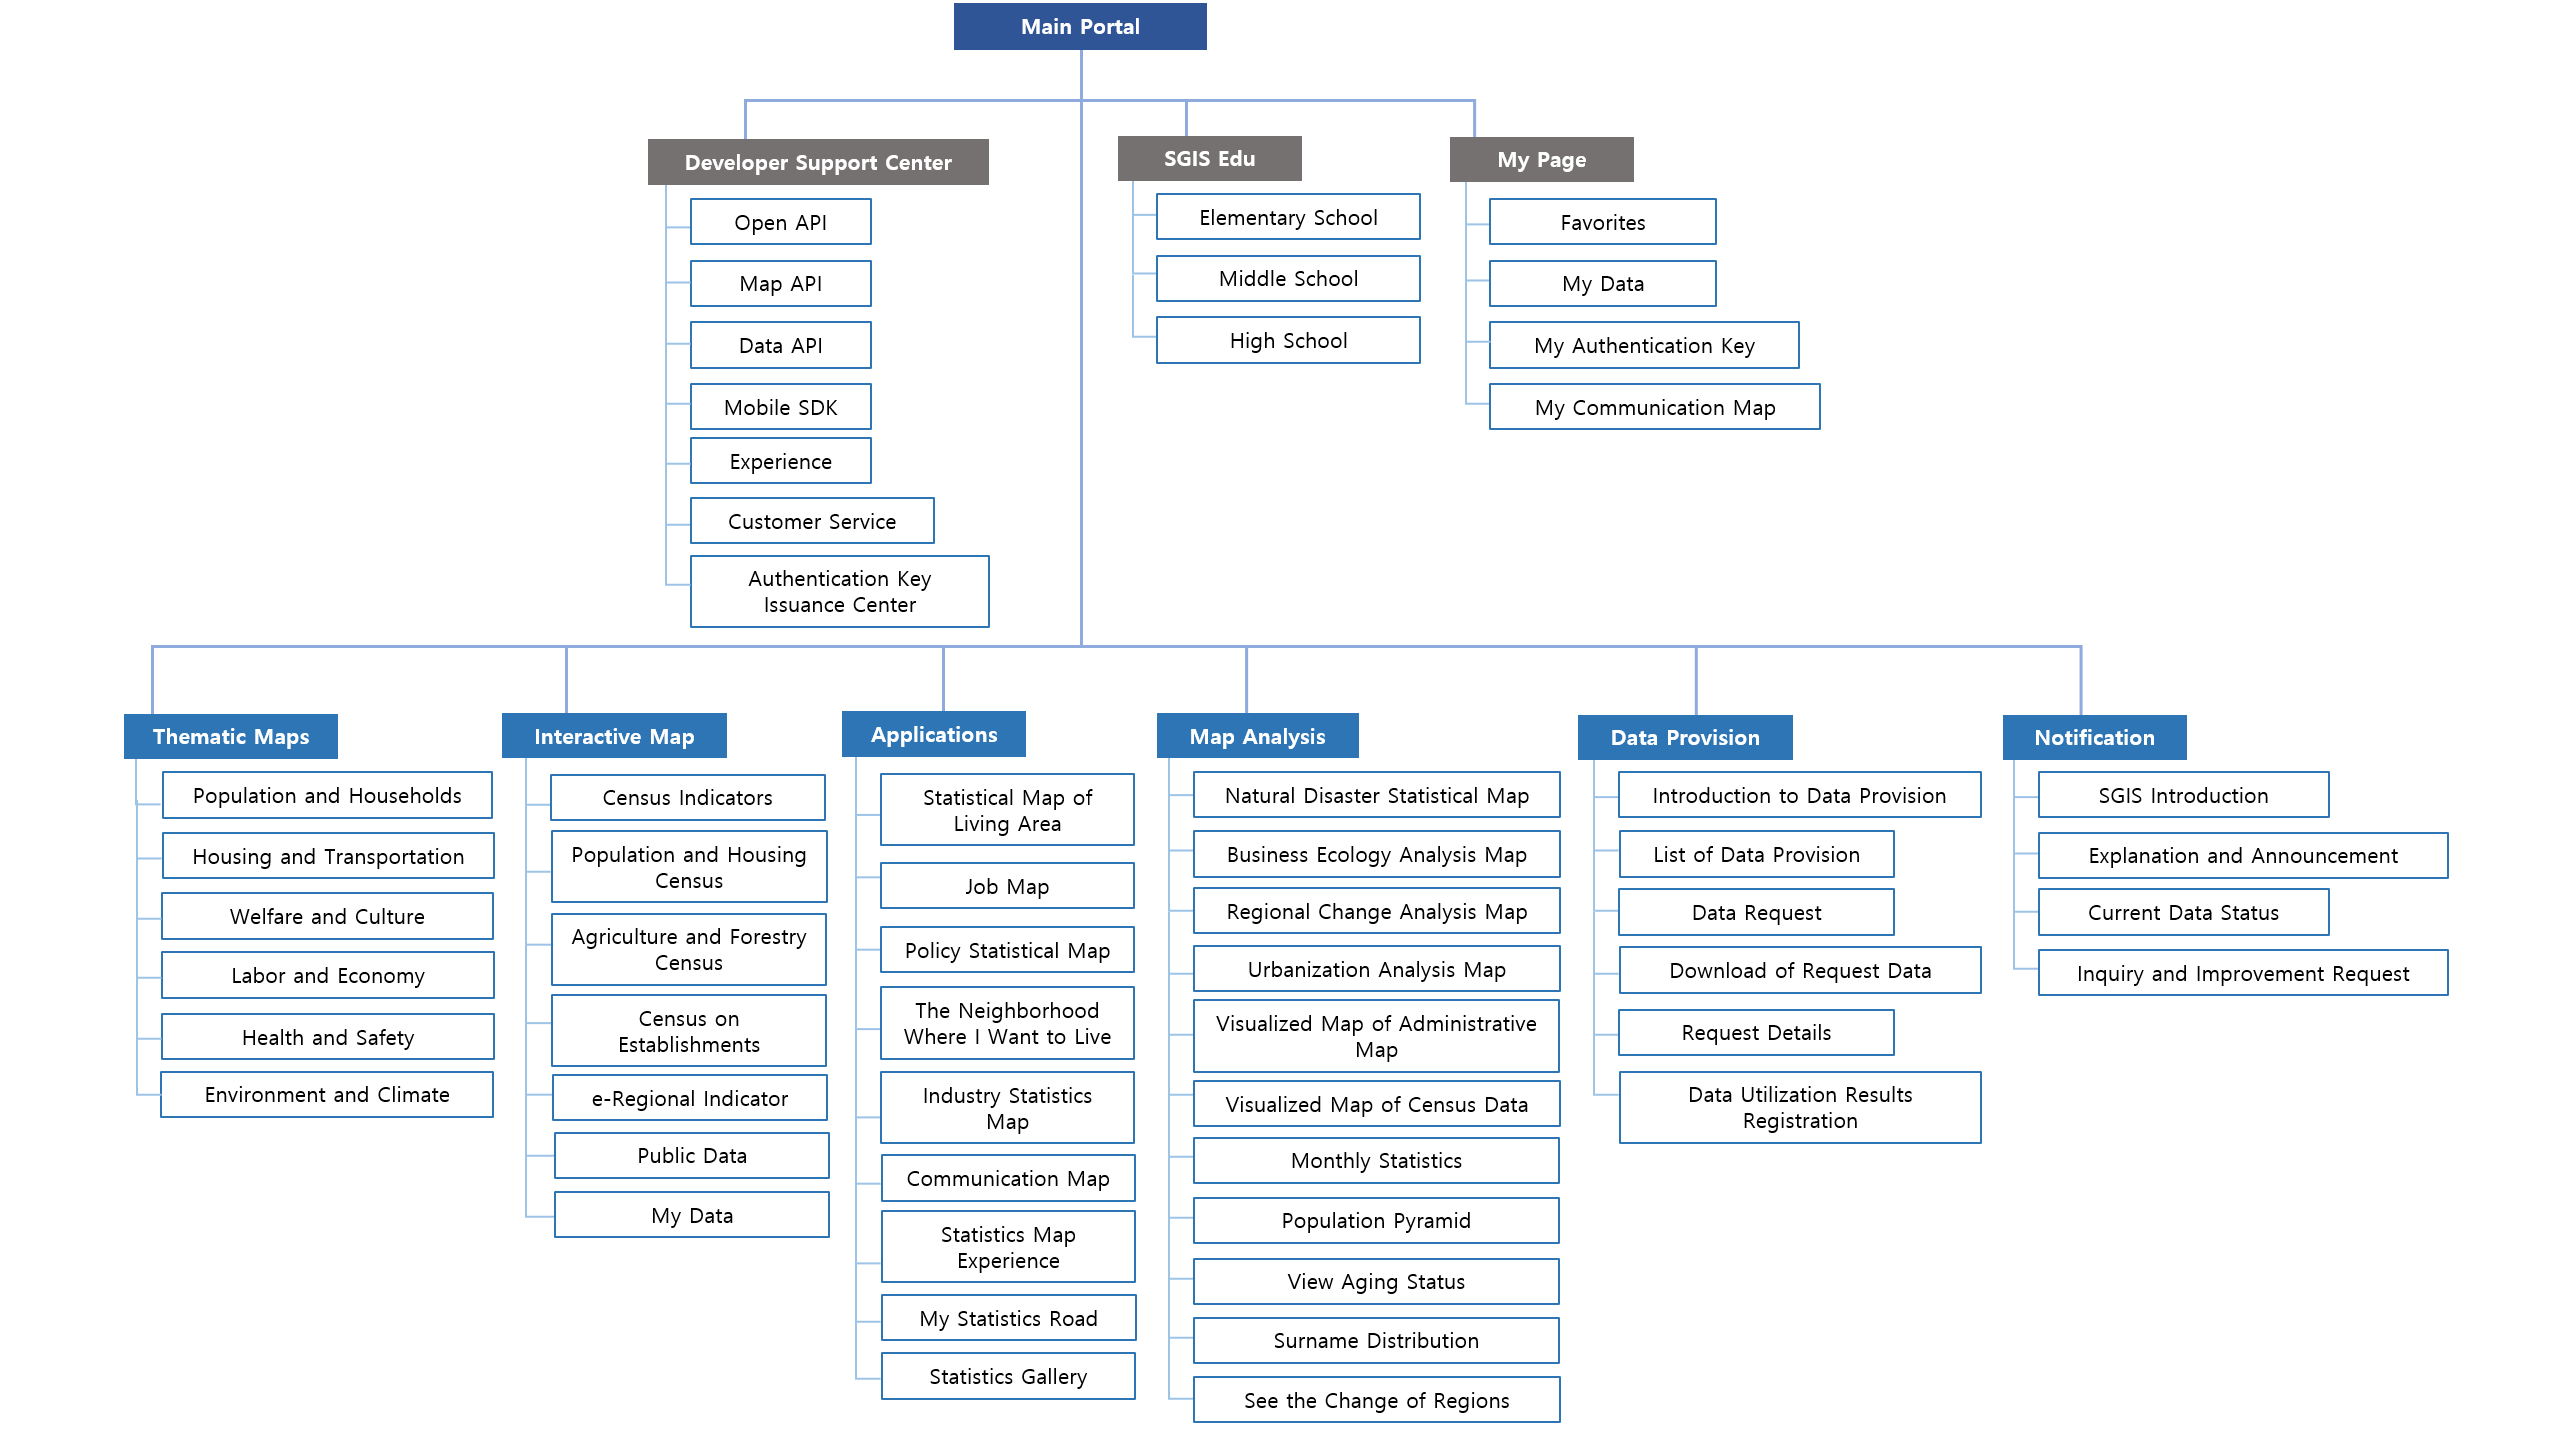
Menu structure
Content List
| Content Type | Service Contents |
|---|---|
| Thematic Maps | Statistical thematic maps are provided for the following topics: Population & Households, Housing & Transportation, Welfare & Culture, Labor & Economy, Health & Safety, and Environment & Climate. |
| Interactive Statistical Map | Census data on population, housing, households, agriculture, forestry, fishing, and establishments as well as regional statistics, are provided through statistical maps. |
| Statistical Map of Living Area | When a user defines a living area based on road information, statistical data for that living area, as well as grid-based data distribution, are provided. |
| Job Map | Job market trends, job market information, the analyses of job market trends and the analyses of employment statistics are provided. |
| Policy Statistical Map | This service provides information on regional demand trends and facility analyses to support policy making. |
| The Neighborhood Where I Want to Live | ‘The Neighborhood Where I Want to Live’ provides recommendations for residential areas based on user-defined criteria. |
| Industry Statistics Map | Characteristic information on daily life industries and technology industries are provided. |
| Regional Issue Communication Map | Community members can generate their own statistical maps to communicate local issues with neighbors. |
| Statistics Map Experience | Users can generate customized statistical maps by inputting their own data through this service. |
| Statistics Gallery | Through Statistics Gallery, users can collect and share statistical information which is retrieved from various statistical portals. |
| Urbanization Analysis Map | This service provides changes in the urbanization areas according to demographic changes, along with grid-based statistical information. |
| Visualization Map of Administrative Statistics | Visualized data including maps and graphs are provided to help statistical users to understand administrative statistics more easily. |
| Visualization Map of Census Data | This service provides time-series geographic information on various sectors—including population, households, housing, agriculture, forestry, fisheries, and the economy—through visualized maps. |
| Monthly Statistics | This service provides key statistics disseminated on a monthly basis, through statistical maps to help users to understand data more easily. |
| Population Pyramid | Based on Population Projections, the age distribution of the population is displayed as a population pyramid, showing both past and future trends. |
| Aging Status View | This service provides aging-related statistics, including regional comparisons of aging status, the analyses of aging trends and data on welfare facilities for the elderly, as well as news briefings. |
| Surname Distribution | This service provides statistical information on the geographic distribution of the top 50 surnames and 99 clans across the country. |
| Regional Trend View | This services provides information showing changes in local areas at five-year intervals from 1995 to 2020. |
| Business Ecosystem Analysis Map | This service provides statistical analysis and time-series trends based on ecological indicators of enterprises. |
| Neighborhood Trend Analysis Map | This service provides various statistical information about the user’s neighborhood at the Si, Gun & Gu administrative district level. |
| Statistical Map of Natural Disasters | This service provides statistical information such as the population and establishments of the areas affected by natural disasters including typhoons, floods, and landslides. |
| Youth Statistics Map | Using data from the youth statistics register, this service presents changes in the youth population. |
History
| 2025 | The ‘Youth Statistics Map’ service was launched. |
|---|---|
| 2024 | The service of ‘The Neighborhood Where I Want to Live’ was upgraded, and the ‘Statistical Map of Natural Disasters’ service was launched. |
| 2023 | Services such as ‘Business Ecosystem Analysis Map’ and ‘Neighborhood Trend Analysis Map’ were launched. |
| 2022 | Services such as ‘Urbanization Analysis Map’ and ‘Visualization Map of Administrative Statistics’ were launched.
The SGIS Education Service was upgraded. |
| 2021 | Services such as ‘Statistical Map of Living Area and ’Visualization Map of Census Data’ were launched. |
| 2020 | Services such as ‘My Statistics Road’ and ‘e-Regional Indicators’ were launched. |
| 2019 | The ‘Job Map’ service was launched, and the map-based statistics search function was upgraded. |
| 2018 | The user interface of ‘Analysis Map’ was revised. In ‘Thematic Maps’, 3 kinds of statistical indicators including emergency facility access status were newly added.
The first phase of the SGIS Smart Platform was developed. |
| 2017 | Services such as ‘Policy Statistical Map’, ‘Technical Industry Statistics Map’ and ‘Statistics Gallery’ were launched, along with grid-based data services. |
| 2016 | Services such as ‘The Neighborhood Where I Want to Live’ and ‘Regional Issue Communication Map’ were launched, along with a mobile service and the Location-based Data Management System. |
| 2015 | The SGIS Open Platform for the entire nation was launched. (Interactive Statistical Map, Thematic Map, Life Industry Statistics Map, etc.) |
| 2014 | The first phase of the SGIS Open Platform was developed. |
| 2013 | The Information Strategy Planning (ISP) for the SGIS Open Platform was developed. |
| 2012 | The SGIS interface and features were upgraded, and the Open API was improved. |
| 2011 | Services such as ‘Time Series Data of Statistical Maps’, ‘S-Statistics Navigator’ and ‘Map-based Statistics by Administrative District’ were launched. |
| 2009 | The SGIS for the entire nation was launched. |
| 2008 | The SGIS system was developed and expanded to the entire nation. |
| 2007 | A pilot service of the SGIS for metropolitan cities was launched in December. |
| 2006 | A pilot service of the SGIS for Daejeon was launched in December. |
