

Thematic Maps
Service Overview
○ It is a service that can easily check the statistical information by interest according to the main topic related to statistics.
○ It is a service that institutionalized interested statistics according to five categories of population and household, housing and transportation, welfare and culture, labor and economy, environment and safety.
○ Reflecting social issues and trends, it provides more than 90 thematic themes and is constantly added according to social trends.
○ Topic display type
- Color Type Theme: It is the basic form to express statistical information by administrative area in color.
- Increment / Decrement Type Theme: It uses the increase / decrease of two different data to show whether the increase or decrease is by region.
- Time series type theme diagram: It is a theme type for displaying change according to the viewpoint. It can be viewed as a color type for each view point, and charts the change of information at each view point of the area.
- Split type theme: It is a theme type that can directly compare two pieces of data. Express data that is considered to be relevant or highly relevant to be compared by region.
Screen Layout
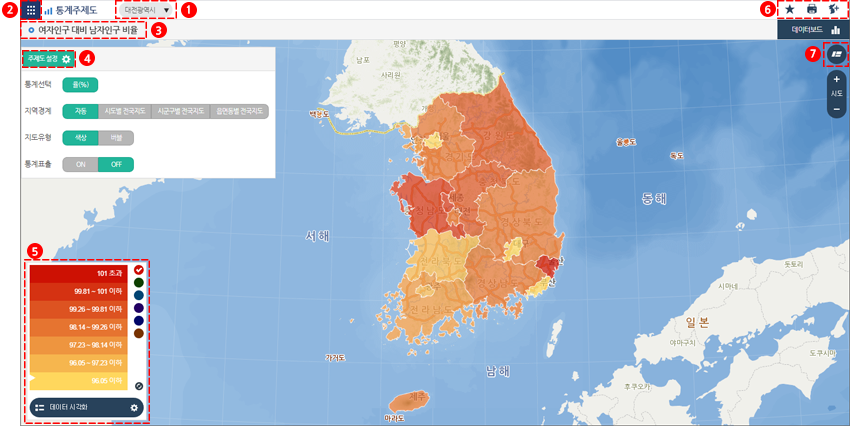
1) Region setting: The area corresponding to the center of the map is set. Therefore, the information is updated when you move the map.
2) Topic list: A list of thematic categories and thematic maps appears.
3) Topic Title: Title of the statistic being displayed.
4) Set Topic: Set statistical information representation such as statistics selection, area boundary selection, map type, statistical presentation.
5) Data visualization: Adjust the legend of statistical information.
6) Print and Topic Request: This is a function that prints a theme and requests to add a new topic.
7) Map Type: Change the background map to General / Satellite.
