

Interactive Statistical Map
Go to Service (Korean) Go to Service (English)Service Overview
○ It is statistical geographical information service which can freely inquire various statistical information such as population, housing, household, agriculture, forestry fishery, business census and administrative district statistics on a regional basis.
○ You can subdivide various statistical items into conditions and display them according to your interests.
○ You can preset the desired statistical items and drag and drop them on the map area,You can view statistics by double-clicking the selected item twice in a row.
○ Space statistics information can be displayed easily and quickly.
○ Features
- Setting statistical search conditions: Setting various search conditions for statistics such as population / housing / household / business
- Statistical information display: statistical information of statistical search condition is visualized on map
- POI marker display: Display the business location corresponding to the category selected by the user in the form of marker on the map
- User data display: Personal data can be uploaded and displayed on the map and can be analyzed.
- Multi-view: You can display statistical maps to compare regional differences for the same conditions or compare different statistical conditions for the same region
Screen Layout
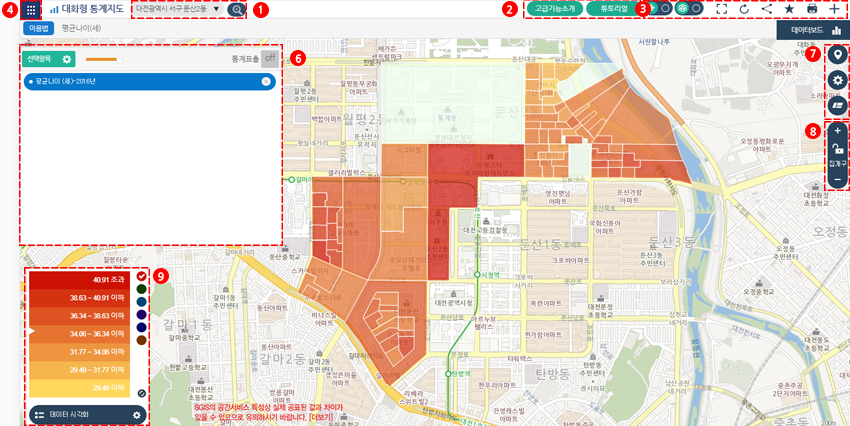
1) Regional Settings: Set to go to a specific area on the map.
- As you move the map, the coordinates of the center of the map will be transformed to show the local name.
2) Tutorial: Take a tutorial for first time users.
3) Additional function for the user: It performs business map development, data upload, initialization, bookmarking, sharing and so on.
- Business Layout: Displays (on / off) the building on which the business floor layout is provided.
- Upload Data: You can display data collected by individuals on the map.
- Reset: Initializes the current map screen.
- Bookmarks: You can bookmark statistics you are viewing separately.
- Sharing: Provide URLs to share the metrics you've viewed.
- Map multiple view: Split the map screen left / right so that various views / comparisons can be made (up to 3 multiple views are possible).
4) Set up statistical items: Set statistical items and detailed conditions.
5) Data Visualization (Percentage): Provides the ratio between upper and lower regions for the statistical data that has been viewed.
- Data visualization (number): Provides numerical values for each detail area (area) of the statistical data viewed.
- Time series display: Selects and displays data for each statistical item by year.
6) Statistics button: Statistic items to be displayed are added as buttons.
- The statistics button is saved and each statistics button is displayed by "drag-and-drop" or double-click on the map where the border is displayed.
- Since the statistics button is saved, there is no need to regenerate the same condition again.
- Delete statistics button: You can delete the created statistics button.
7) Map add-on: Perform distance, area calculation and POI display in the map window.
- Provides range measurement, area lookup, and POI display function on the map.
- User scope measurement: Area and Distance Measurement
- View User’s Area: You can inquire statistics about regions created by users, such as circles, rectangles, and polygons.
(However, data lookup for the current released statistic is only available.)
- POI: Brief information on businesses classified into 9 major themes
8) Scale Adjustment: Adjusts the scale of the map. You can zoom in / out on the map.
9) Data visualization: It displays legend of displayed statistical value and can change legend setting.
- It is a legend of visualized data on the map. You can set custom criteria such as the legend level, color, etc. through user setting.
