- 준비하기
- 주요기능 소개
-
기능별 사용예제 보기
- 시작하기
- 시작하기
- 지도
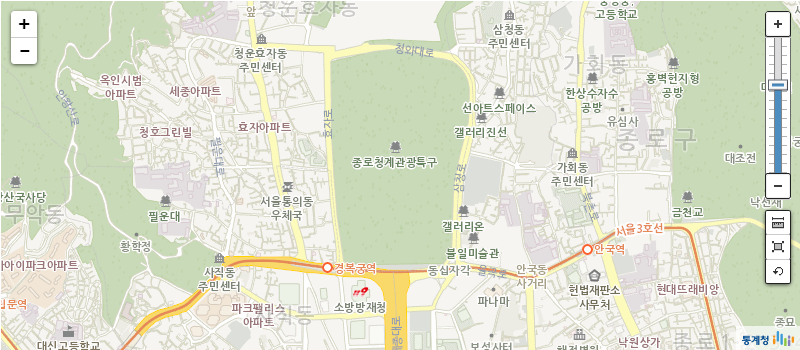
- 지도 생성
- 지도 이동
- 지도 줌 레벨 변경
- 지도 정보 가져오기
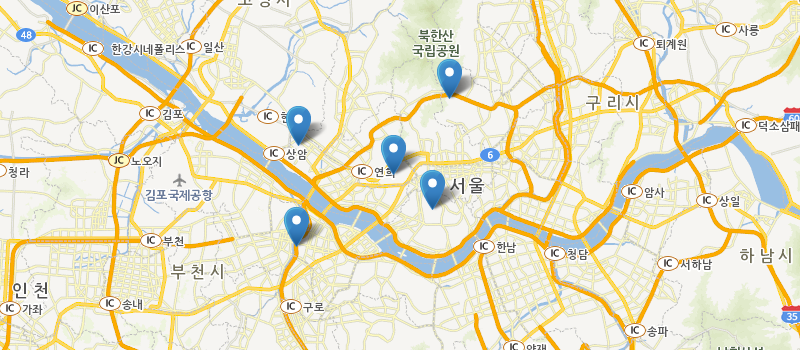
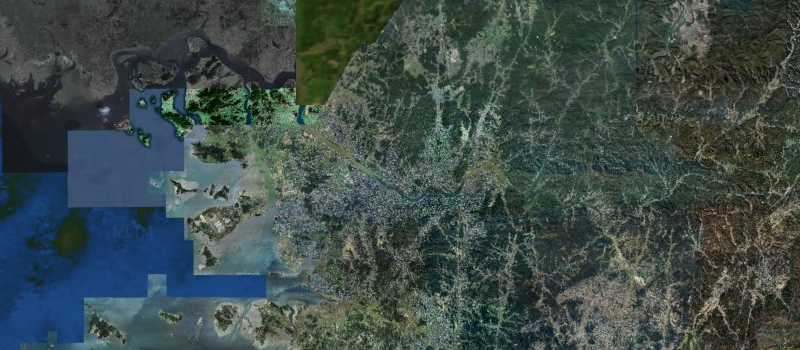
- 지도 타입 변경(지도<->위성)
- 이동 이벤트 등록
- 확대/축소 이벤트 등록
- 지도 생성 이벤트 등록
- 지도 클릭 이벤트 등록
- 지도 이동 막기
- 지도 확대/축소 막기
- HTML5 Geolocation API 활용
- 좌표변환(WGS84 to UTMK)
- 지도 선택지점 좌표가져오기
- 지도 영역 바운더리정보 가져오기
- 컨트롤
- 축척 컨트롤
- 지도 이동 컨트롤
- 줌 컨트롤
- 측정 컨트롤(면적, 길이)
- 커스텀 컨트롤
- 오버레이
- 마커 생성
- 마커에 인포윈도우 생성
- 커스텀 인포윈도우 생성
- 마커에 클릭 이벤트 등록
- 마커 클러스터 생성
- 이미지 마커 생성
- 커스텀 마커 생성
- 서클 마커 생성
- 마커 z-index 변경
- 폴리라인 생성
- 폴리곤 생성
- 원 생성
- 사각형 생성
- GeoJSON
- 폴리곤 캡션 생성
- 폴리곤 이벤트 생성
- KML
- 히트맵
- 응용 샘플
- 마커 투명도 조절
- 마커 이미지 변경
- 열지도 반지름/투명도 조절
- 폴리곤에 포함된 마커 찾기
- 마커 클러스터 반경설정
- 최외각 마커의 폴리곤 생성
- 서클 마커 설정
- 데이터 시각화
- 폴리곤에 캡션적용
- 여러 개 마커 제어하기

- 준비하기
- SGIS 지도 API는 인증키 발급을 받아야 사용할 수 있습니다. 사용자가 발급받은 키로 트래픽을 관리하여 모든 사용자에게 원활한 서비스를 제공하기 위함입니다. 열쇠모양의 버튼을 클릭하면 인증키 생성 관리 페이지로 이동합니다. 아직 발급받은 키가 없다면 해당 페이지에 접속하여 키를 발급 받으세요.


테스트키 신청방법
약관동의 → 정보입력 → 테스트키 신청 → 즉시발급
상용키 신청방법
마이페이지 → 테스트키 정보수정 → 신청 → 승인 → 사용
- 주요기능 소개
- 아래의 표는 지도API에서 제공하는 주요 기능에 대한 설명입니다.
-
API에서 제공하는 주요 기능에 대한 설명 기능 기능 설명 지도 생성 일반지도, 항공영상, 하이브리드 지도를 웹상에 생성하고 표출합니다. 지도 이동 및 컨트롤 제공 마우스에 의한 지도 이동을 지원하고 지도 이동을 위한 UI 컨트롤을 제공합니다. 지도 줌 및 컨트롤 제공 마우스에 의한 지도 줌을 지원하고 레벨별 지도 줌을 위한 UI 컨트롤을 제공합니다. 축척 컨트롤 현재 지도의 축척 표출을 위한 UI를 제공합니다. 마커 및 정보창 지도위의 특정지점을 표출하기 위한 마커와 연관정보를 표출하기 위한 정보창을 제공합니다. 원 및 선 그리기 지도위에 원과 선을 그릴 수 있습니다. 선과 면에 대한 색상 및 투명도 설정을 제공합니다. 다각형 그리기 지도위에 다각형을 그릴 수 있습니다. 선과 면에 대한 색상 및 투명도 설정을 제공합니다.
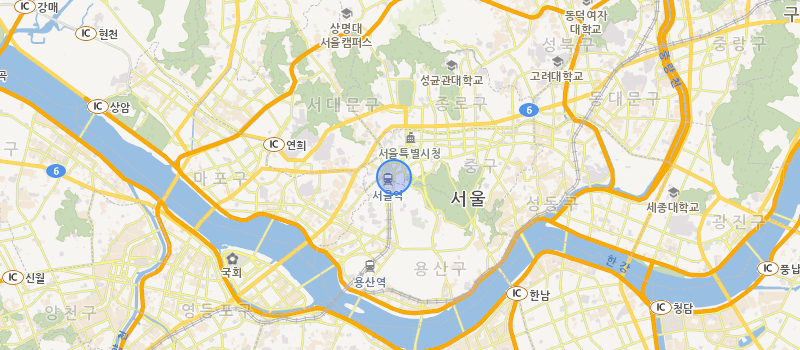
- 시작하기
- SOP JavaScript 를 가장 쉽게 배울 수 있는 방법은 간단한 예제를 한번 작성해 보는 것입니다.
아래에 기술된 HTML페이지는 서울시 종로구 경복궁을 중심으로 지도를 출력합니다.
예제소스
					 <!DOCTYPE html>
				     <html lang="ko">
			         <head>
			            <title>SOP JavaScript : Map Simple</title>
			            <meta charset="utf-8">
			            <meta name="viewport" content="width=device-width, initial-scale=1.0">
			            <script type="text/javascript" src="https://sgisapi.kostat.go.kr/OpenAPI3/auth/javascriptAuth?consumer_key=[발급받은 서비스키]"></script>
			         </head>
			         <body>
			            <div id="map" style="width:500px; height:500px;"></div>
			            <script type="text/javascript">
			                 var map = sop.map('map');
			                map.setView(sop.utmk(953820, 1953437), 9);
			            </script>
			         </body>
				</html>
1. Javascript API 불러오기
- 웹브라우저에 지도를 표출하기 위해서는 먼저 Javascript API를 불러와야 합니다.
-
위의 스크립트 태그를 <head> 또는 <body> 태그 안에 넣습니다.
단, 실행코드 보다 먼저 선언되어야 합니다.
서비스키는 인증키 신청을 통해 발급받을 수 있습니다.
2. 지도 영역 그리기
- 다음으로 지도를 표출할 영역을 생성해야 합니다.
-
웹페이지에서 지도를 출력하기 위해서는 지도가 그려질 영역을 확보해야 합니다.
이를 위해 일반적으로 div 엘리먼트를 DOM에 추가하고 이 엘리먼트의 레퍼런스를 활용합니다.
위의 예제에서는 "map" 을 아이디로 갖는 <div> 엘리먼트를 생성하고, CSS Style 속성을 이용해서 크기를 지정했습니다.
3. 지도 객체(Map Object) 생성 및 Options
- 다음으로 지도를 표출할 영역을 생성해야 합니다.
map.setView( sop .utmk( 953820, 1953437 ), 9 );
-
지도를 나타내는 Javascript 클래스는 sop.Map 클래스입니다. 이클래스는 객체는 웹페이지 내에서 하나의 지도를 정의합니다.
물론, 페이지 내에서 하나 이상의 Map 객체를 생성할 수 있으며, 이때 각각의 Map 객체는 서로 다른 지도를 나타냅니다.
맵 객체를 생성할 때, sop.map 함수에 파라미터로 웹페이지 내에 맵이 출력될 영역에 해당하는 <div>의 엘리먼트 아이디를 넣습니다.
이렇게 생성된 맵 객체에 setView 함수로 센터좌표와 줌 레벨을 설정하여 실제 지도를 화면에 표출합니다.
센터좌표는 UTMK 좌표계를 사용하며, 좌표는 위도(latitude) 와 경도(longitude) 순으로 넣고, 다음으로 줌 레벨을 지정해줍니다.
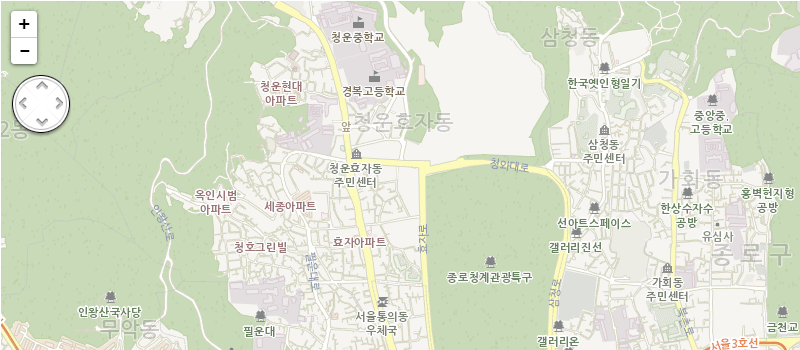
- 지도 생성
-
지도를 생성하는 기본적인 예제입니다.
sop.map 함수로 맵 객체를 생성하고, setView 함수에 센터좌표와 줌 레벨을 설정하여 맵을 생성합니다.
예제소스
</> 소스 예제 실행
					  var map = sop.map('map');
					  map.setView(sop.utmk(953820, 1953437), 9);
실행결과

- 지도 이동
-
맵의 지도 이동을 컨트롤하는 예제입니다.
페이지 내에서 생성한 맵 객체를 setView 함수를 이용하여 센터좌표와 줌 레벨을 설정하면 해당 중심좌표로 지도가 이동합니다.
이동 시, setView 함수 내의 animate 옵션으로 애니메이션 효과를 지정할 수 있습니다.
예제소스
</> 소스 예제 실행
					  var map = sop.map('map');
					  map.mapMove = function (center, zoom, animate) {
					   if (animate == null) {
					    animate = true; //false로 설정할경우 애니메이트 효과 끔
					   }

					   if (center != null) {
					    this.center = map.center;

					    if (zoom != null) {
					     this.zoom = zoom;
					     this.setView(sop.utmk(center[0], center[1]), zoom, {
					      animate : animate
					     });
					    }
					    else {
					     this.setView(sop.utmk(center[0], center[1]), {
					      animate : animate
					     });
					    }
					   }
					  }

					  map.setView(sop.utmk(953820, 1953437), 9);
					  map.mapMove([953810,1953437],7);

					  function mapMove(direction){

						  var center = map.getCenter();
						  var x = center.x;
						  var y = center.y;

						  switch(direction){
						  	case  "top" :
						  		y = y+2000;
						  		break;
						  	case  "bottom" :
						  		y = y-2000;
						  		break;
						  	case  "right" :
						  		x = x+2000;
						  		break;
						  	case  "left" :
						  		x = x-2000;
						  		break;
						  }
						  map.mapMove([x,y],7,true);
					  }
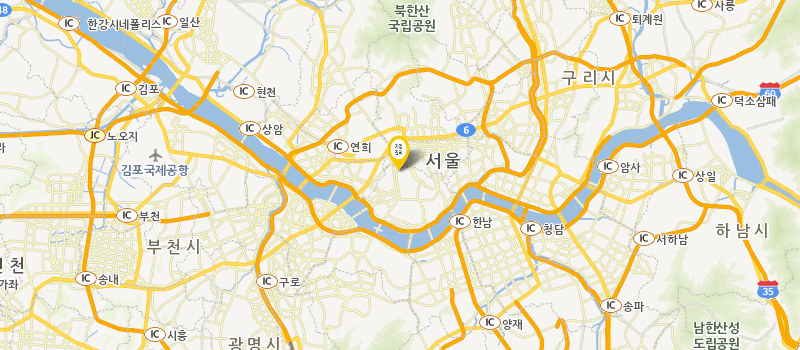
- 지도 줌 레벨 변경
-
지도의 줌 레벨을 변경하는 예제입니다.
지도의 줌 레벨을 변경하기 위해서는 setZoom 함수를 사용합니다.
다음은 지도의 줌 레벨을 10으로 변경하는 코드입니다.
지도의 줌 레벨을 현단계에서 한단계씩 확대 시키려면 zoomIn 함수를 사용하고 축소 시키려면 zoomOut 함수를 사용합니다.
이 함수들은 현재 줌 레벨에서 한 단계씩 확대하거나 축소되며, 특정 줌 레벨로 바로 이동 시에는 setZoom 함수를 사용합니다.
예제소스
</> 소스 예제 실행
				var map = sop.map('map');
				map.setView(sop.utmk(953820, 1953437), 1);
				map.zoomIn();
				map.zoomOut();

				function zoomIn(){
				 map.zoomIn(); // 줌 레벨 한단계 확대
				}

				function zoomOut(){
				 map.zoomOut(); // 줌 레벨 한단계 축소
				}

				function setZoom(val){
				 map.setZoom(val);
				}
- 지도 정보 가져오기
-
지도 생성에 관련한 정보를 호출하는 예제입니다.
생성된 맵 객체에 대한 center 정보, 줌 레벨 정보, 바운더리 정보 등을 가져올수 있습니다.
getCenter 함수는 현재 지도의 중심좌표를 반환하며, getZoom 함수는 현재 지도의 줌 레벨을 반환합니다.
getBounds 함수는 현재 화면상의 지도 바운더리 정보을 반환합니다.
예제소스
</> 소스 예제 실행
var map = sop.map('map');
map.setView(sop.utmk(953820, 1953437), 9);
var center = map.getCenter();
var level = map.getZoom();
var bounds = map.getBounds();
var swLatLng = bounds.getSouthWest();
var neLatLng = bounds.getNorthEast();
var html = "센터 : "+center.x+","+center.y+"
";
html +="줌 레벨 : "+level+"
";
html +="swLatLng : "+swLatLng+"
";
html +="neLatLng : "+neLatLng+"
";
$("#divCon").html(html);
실행결과

줌 레벨 : 9
swLatLng : UTMK(952522, 1952637)
neLatLng : UTMK(955122, 1954237)
- 지도타입 변경(지도<->위성)
-
지도 타입을 변경하는 예제입니다.
sop.map으로 생성한 지도의 타일 형식을 위성지도로 변경 할수 있습니다.
현재 위성지도는 외부 TMS 와 연계하여 제공하는 것으로, 해당 위성지도에 대한 좌표체계, 바운더리정보, resolution, 옵션정보 등을 이용하여
타일레이어를 생성하여 제공됩니다.
위처럼 외부 TMS 에서 제공되는 타일의 정보를 알 수 있다면, 얼마든지 외부 타일을 표출할 수 있습니다.
예제소스
</> 소스 예제 실행
				var map = sop.map('map');
				var mapMode = "normal";

				var zoomMargin, crs ,baseTileLayer, targetTileLayer;
				function changeMode(type){
					 if (type == "settlite") {
					  mapMode = "settlite";
					  crs = createSatelliteCRS();
					  baseTileLayer = createSatelliteTileLayer();
					  targetTileLayer = map.statisticTileLayer;
					  zoomMargin = baseTileLayer.options.minZoom - targetTileLayer.options.minZoom;
					  createTileLayer(map, crs, baseTileLayer, targetTileLayer, zoomMargin);
					 }else {
					  mapMode = "normal";
					  targetTileLayer = baseTileLayer;
					  baseTileLayer = map.statisticTileLayer;
					  zoomMargin = baseTileLayer.options.minZoom - targetTileLayer.options.minZoom;
					  createTileLayer(map, sop.CRS.UTMK, baseTileLayer, targetTileLayer, zoomMargin);
					 }
				}

				function changeMap(){
					if(mapMode == "settlite"){
						changeMode("normal");
					}else{
						changeMode("settlite");
					}
				}

				/**
				 *
				 * @name         : createSatelliteCRS
				 * @description  : 위성지도에 사용하는 좌표체계 생성
				 */
				function createSatelliteCRS(){
				 var code = 'EPSG:900913';
				 var def = '+proj=merc +a=6378137 +b=6378137 +lat_ts=0.0 +lon_0=0.0 +x_0=0.0 +y_0=0 +k=1.0 +units=m +nadgrids=@null +no_defs';
				 var options = {
				  resolutions: [
				   156543.0339,
				   78271.51695,
				   39135.758475,
				   19567.8792375,
				   9783.93961875,
				   4891.969809375,
				   2445.9849046875,
				   1222.99245234375,
				   611.496226171875,
				   305.7481130859375,
				   152.87405654296876,
				   76.43702827148438,
				   38.21851413574219,
				   19.109257067871095,
				   9.554628533935547,
				   4.777314266967774,
				   2.388657133483887,
				   1.1943285667419434,
				   0.5971642833709717,
				   0.29858214168548586,
				   0.14929107084274293
				  ],
				  origin: [-20037508.34, 20037508.34]
				 };

				 // 새로 정의한 CRS 객체 생성.
				 var crs = new sop.CRS.Proj(code, def, options);

				 // projection 영역 설정.
				 crs.projection.bounds = sop.bounds(
				   [13232210.28055642, 3584827.864295762],
				   [15238748.249933105, 5575460.5658249445]
				 );

				 return crs;
				}

				/**
				 *
				 * @name         : createTileLayer
				 * @description  : 타일레이어 토글버튼 생성
				 */
				function createTileLayer(map, crs, baseLayer, targetLayer, zoomMargin) {
				 if(arguments.length < 5) {
				  throw new Error('Fail check arguments length. current = ' + arguments.length);
				 }

				 if(map.hasLayer(baseLayer)){
				  return;
				 }
				 var center = map.getCenter();
				 var zoom = map.zoom;
				 map.removeLayer(targetLayer);
				 map.options.crs = crs;
				 baseLayer.addTo(map);

				 //좌표 초기화
				 map.setView(sop.utmk(953820, 1953437), 9);
				}


				/**
				 *
				 * @name         : createSatelliteTileLayer
				 * @description  : 위성 타일레이어 생성
				 */
				function createSatelliteTileLayer(){
				var satTileURL = "https://xdworld.vworld.kr/2d/Satellite/service/{z}/{x}/{y}.jpeg";
				 var satTileOptions = {
				  maxZoom: 18,
				  minZoom: 6
				 };
				 var satTileLayer = new sop.TileLayer(satTileURL, satTileOptions);
				 return satTileLayer;
				}

				map.setView(sop.utmk(953820, 1953437), 9);
실행결과
- 이동 이벤트 등록
-
지도 화면이 이동하고 정지하는 동작을 감지하는 예제입니다.
지도에 대한 이벤트 등록은 on 함수를 통해 등록할 수 있습니다.
지도의 이동 시작 이벤트는 movestart 를 사용하며, 이동 종료 이벤트는 moveend 를 사용합니다.
예제소스
</> 소스 예제 실행
var map = sop.map('map');
map.setView(sop.utmk(953820, 1953437), 9);
map.on("movestart",function(e) {
setTimeout(function() {
var html = ""+ getTime() + " 이동 시작
";
$("#divCon").append(html);
}, 200);
});
map.on("moveend",function(e) {
setTimeout(function() {
var html = ""+ getTime() + " 이동 끝
";
$("#divCon").append(html);
}, 200);
});
function getTime(){
var date = new Date();
var m = date.getMonth()+1;
var d = date.getDate();
var h = date.getHours();
var i = date.getMinutes();
var s = date.getSeconds();
return date.getFullYear()+'-'+(m>9?m:'0'+m)+'-'+(d>9?d:'0'+d)+' '+(h>9?h:'0'+h)+':'+(i>9?i:'0'+i)+':'+(s>9?s:'0'+s);
}
- 확대/축소 이벤트 등록
-
지도화면의 확대 및 축소 동작을 감지하는 예제입니다.
지도에 대한 이벤트 등록은 on 함수를 통해 등록할 수 있습니다.
지도의 확대 및 축소 시작 이벤트는 zoomstart 를 사용하며, 종료 이벤트는 zoomend 를 사용합니다.
예제소스
</> 소스 예제 실행
var map = sop.map('map');
map.setView(sop.utmk(953820, 1953437), 9);
map.on("zoomstart",function(e) {
setTimeout(function() {
var html = ""+ getTime() + " 줌 시작
";
$("#divCon").append(html);
}, 200);
});
map.on("zoomend",function(e) {
setTimeout(function() {
var html = ""+ getTime() + " 줌 종료
";
$("#divCon").append(html);
}, 200);
});
function getTime(){
var date = new Date();
var m = date.getMonth()+1;
var d = date.getDate();
var h = date.getHours();
var i = date.getMinutes();
var s = date.getSeconds();
return date.getFullYear()+'-'+(m>9?m:'0'+m)+'-'+(d>9?d:'0'+d)+' '+(h>9?h:'0'+h)+':'+(i>9?i:'0'+i)+':'+(s>9?s:'0'+s);
}
- 지도 생성 이벤트 등록
-
지도 생성 동작을 감지하는 예제입니다.
whenReady 를 사용하여 맵 생성이 완료된 후의 이벤트를 감지할 수 있습니다.
예제소스
</> 소스 예제 실행
var map = sop.map('map');
map.whenReady(function(e) {
$("#divCon").append(""+getTime()+"생성완료
");
});
function getTime(){
var date = new Date();
var m = date.getMonth()+1;
var d = date.getDate();
var h = date.getHours();
var i = date.getMinutes();
var s = date.getSeconds();
return date.getFullYear()+'-'+(m>9?m:'0'+m)+'-'+(d>9?d:'0'+d)+' '+(h>9?h:'0'+h)+':'+(i>9?i:'0'+i)+':'+(s>9?s:'0'+s);
}
map.setView(sop.utmk(953820, 1953437), 9);
- 지도 클릭 이벤트 등록
-
지도 위를 클릭하는 동작을 감지하는 예제입니다.
지도에 대한 이벤트 등록은 on 함수를 통해 등록할 수 있습니다.
특히, 클릭에 대한 이벤트는 on 함수의 파라미터로 click 선언을 통해 등록 할수 있습니다.
예제소스
</> 소스 예제 실행
var map = sop.map('map');
map.setView(sop.utmk(953820, 1953437), 9);
map.on("click",function(e) {
setTimeout(function() {
var x_coor = e.utmk.x;
var y_coor = e.utmk.y;
var html = ""+ getTime() + " 지도클릭 좌표 x :"+x_coor+" , y :"+y_coor+"
";
$("#divCon").append(html);
}, 200);
});
function getTime(){
var date = new Date();
var m = date.getMonth()+1;
var d = date.getDate();
var h = date.getHours();
var i = date.getMinutes();
var s = date.getSeconds();
return date.getFullYear()+'-'+(m>9?m:'0'+m)+'-'+(d>9?d:'0'+d)+' '+(h>9?h:'0'+h)+':'+(i>9?i:'0'+i)+':'+(s>9?s:'0'+s);
}
- 지도 이동 막기
-
지도 화면 이동을 막는 기능의 예제입니다.
생성된 지도에 대하여 드래그 이동 불가 여부를 dragging 객체를 통해 설정할 수 있습니다.
disable 함수는 드래그 이동 막기를 수행하고, enable 함수는 드래그 이동을 다시 수행합니다.
예제소스
</> 소스 예제 실행
					var map = sop.map('map');
					map.setView(sop.utmk(953820, 1953437), 9);
					map.dragging.disable();
- 지도 확대/축소 막기
-
지도 확대 및 축소 기능을 제한하는 예제입니다.
생성된 맵에서 스크롤링 이벤트 제어는 scrollWheelZoom 객체를 이용합니다.
disable 함수는 스크롤링 이벤트 막기를 수행하고, enable 함수는 스크롤링 이벤트를 다시 수행합니다.
예제소스
</> 소스 예제 실행
					var map = sop.map('map');
					map.setView(sop.utmk(953820, 1953437), 9);
					map.scrollWheelZoom.disable(); //zoomin zoomout 불가
- HTML5 Geolocation API 활용
-
HTML5 Geolocation API를 활용하는 예제입니다.
HTML5 에서 제공하는 Geolocation을 활용하여 현재 좌표를 가져온 후, sop.LatLng을 이용하여 UTMK로 변환하여 사용할 수 있습니다.
예제소스
</> 소스 예제 실행
var map = sop.map('map');
map.setView(sop.utmk(989674, 1818313), 9);
function getLocationCoords(){
var center = [989674, 1818313];
if (navigator.geolocation) {
navigator.geolocation.getCurrentPosition(function (position) {
var utmkXY = new sop.LatLng (position.coords.latitude, position.coords.longitude);
center = [utmkXY.x, utmkXY.y];
console.log(position.coords.latitude);
console.log(position.coords.longitude);
var html = "latitude = " + position.coords.latitude +" , longitude " + position.coords.longitude+"
";
html += "x = "+utmkXY.x+", y="+utmkXY.y+"
";
$("#divCon").append(html);
});
}
/* return center; */
}
getLocationCoords();
- 좌표변환(WGS84 TO UTMK)
-
좌표 규격을 변환하는 예제입니다.
현재 SGIS에서 사용하는 좌표계는 UTMK를 활용합니다.
WGS84를 sop.LatLng을 통해 UTMK로 변환하여 사용할 수 있습니다.
예제소스
</> 소스 예제 실행
var map = sop.map('map');
var utmkXY = new sop.LatLng (36.3504119,127.3845475); //wgs84 좌표를 UTMK로 변환
map.setView(sop.utmk(utmkXY.x, utmkXY.y), 9);
var html = "wgs84 : 36.3504119,127.3845475
";
html += "x = "+utmkXY.x+" , y = "+utmkXY.y+"
";
$("#divCon").append(html);
실행결과
UTMK : x = 989640.766152708 , y = 1817006.5606348878
- 지도 선택지점 좌표 가져오기
-
지도상에서 클릭한 지점의 좌표를 불러오는 기능의 예제입니다.
생성한 맵에서 현재 내가 원하는 지역에 대한 좌표값을 contextmenu 이벤트를 등록하여 가져올수 있습니다.
다음은 맵에서 왼쪽 마우스를 클릭시 해당 지역의 좌표 정보를 가져오는 코드 입니다.
예제소스
</> 소스 예제 실행
var map = sop.map('map');
map.setView(sop.utmk(953820, 1953437), 9);
map.on("click",function(e) {
setTimeout(function() {
var x_coor = e.utmk.x;
var y_coor = e.utmk.y;
var html = " 지도클릭 좌표 x :"+x_coor+" , y :"+y_coor+"
";
$("#divCon").append(html);
}, 200);
});
//맵에 왼쪽 마우스 버튼 클릭시 좌표 반환
map.on("contextmenu",function(e) {
setTimeout(function() {
var x_coor = e.utmk.x;
var y_coor = e.utmk.y;
var html = " 지도클릭 좌표 x :"+x_coor+" , y :"+y_coor+"
";
$("#divCon").append(html);
}, 200);
});
- 지도 현재영역 바운더리정보 가져오기
-
지도 바운더리 정보를 가져오는 예제입니다.
현재 생성된 지도의 화면이 포함된 바운더리 정보를 getBounds 함수로 가져 옵니다.
예제소스
</> 소스 예제 실행
var map = sop.map('map');
map.setView(sop.utmk(953820, 1953437), 9);
var bounds = map.getBounds();
var swLatLng = bounds.getSouthWest();
var neLatLng = bounds.getNorthEast();
var html = "southWest = " + swLatLng + " , northEast = " + neLatLng+"
";
$("#divCon").append(html);
실행결과

northEast : UTMK(955422, 1954137)
- 축척 컨트롤
-
지도 생성 시, 축척 컨트롤러 사용여부를 제어하는 예제입니다.
지도 축척 컨트롤러 생성 관련 여부는 scale 속성에서 정의 합니다.
true 와 false 값으로 축척 컨트롤러 생성여부를 제어할 수 있습니다.
예제소스
</> 소스 예제 실행
					var map = sop.map('map',{
					 scale: false // 축척 컨트롤
					});
					map.setView(sop.utmk(953820, 1953437), 9);
실행결과
- 지도 이동 컨트롤
-
지도 생성 시, 지도 이동 컨트롤러 사용여부 제어에 대한 예제입니다.
지도 이동 컨트롤러 생성 관련 여부는 panControl 속성에서 정의합니다.
true 와 false 값으로 지도 이동 컨트롤러 생성여부를 제어할 수 있습니다.
예제소스
</> 소스 예제 실행
					var map = sop.map('map',{
					 panControl: true // 지도 이동 컨트롤
					});
					map.setView(sop.utmk(953820, 1953437), 9);
실행결과
- 줌 컨트롤
-
지도 생성 시, 줌 컨트롤러 사용여부 제어에 대한 예제입니다.
줌 컨트롤러 생성 관련 여부는 zoomSliderControl 속성에서 정의합니다.
true 와 false 값으로 줌 컨트롤러 생성여부를 제어할 수 있습니다.
예제소스
</> 소스 예제 실행
					var map = sop.map('map',{
					 zoomSliderControl: true //줌 컨트롤
					});
					map.setView(sop.utmk(953820, 1953437), 9);
실행결과

- 측정 컨트롤(면적, 길이)
-
지도 생성 시, 측정 컨트롤러 사용여부 제어에 대한 예제입니다.
측정 컨트롤러(면적,길이) 생성 관련 여부는 measureControl 속성에서 정의합니다.
true 와 false 값으로 측정 컨트롤러 생성여부를 제어할 수 있습니다.
예제소스
</> 소스 예제 실행
					var map = sop.map('map',{
					 measureControl: true, // 측정 컨트롤 (면적, 길이)
					});
					map.setView(sop.utmk(953820, 1953437), 9);
실행결과

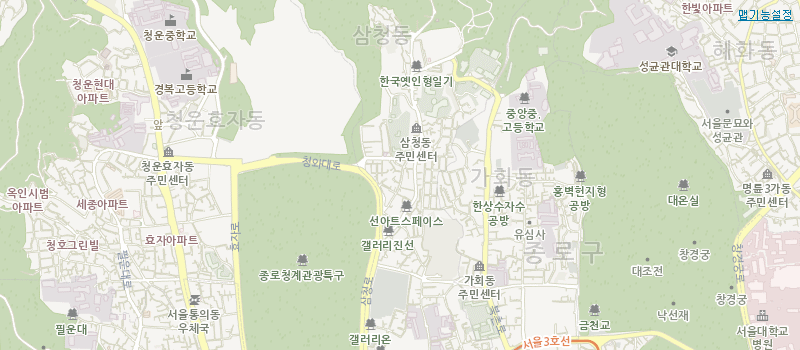
- 커스텀 컨트롤
-
커스텀 컨트롤러 기능을 사용하는 예제입니다.
기존의 컨트롤러가 아닌 별도의 컨트롤러를 사용할 경우 sop.control을 이용하여 html을 생성하여 사용할 수 있습니다.
예제소스
</> 소스 예제 실행
var map = sop.map('map',{
ollehTileLayer: false,
scale: false, // 축척 컨트롤
panControl: false, // 지도 이동 컨트롤
zoomSliderControl: false, //줌 컨트롤
measureControl: false, // 측정 컨트롤 (면적, 길이)
attributionControl: false // 지도속성 컨트롤
});
var setUI = sop.control({position :'topright'});
setUI.onAdd = function(map){
this._div = sop.DomUtil.create('div', 'info');
sop.DomEvent.disableClickPropagation(this._div);
this.update();
$(this._div).attr("id", 'set_map');
return this._div;
}
setUI.update = function(props){
var html = "";
html += "";
html += "맵기능설정";
html += "";
html += "
";
html += "";
this._div.innerHTML = html;
}
setUI.addTo(map);
map.setView(sop.utmk(953820, 1953437), 9);
실행결과
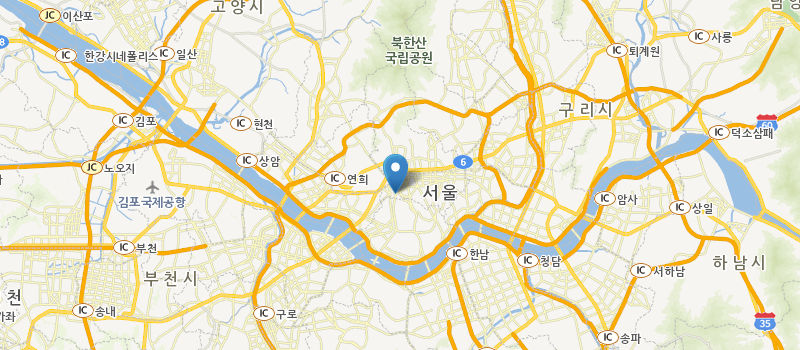
- 마커 생성
-
마커를 생성하는 예제입니다.
마커는 지도 위에 특정 지점을 표시하기 위한 요소입니다.
기본적으로 마커를 생성하기 위해서는 sop.marker 를 이용하며, 파라미터로 생성될 위치정보를 지정합니다.
예제소스
</> 소스 예제 실행
					var map = sop.map('map');
					map.setView(sop.utmk(953427, 1950827), 5);
					var marker = sop.marker([953427, 1950827]);
					marker.addTo(map);
실행결과
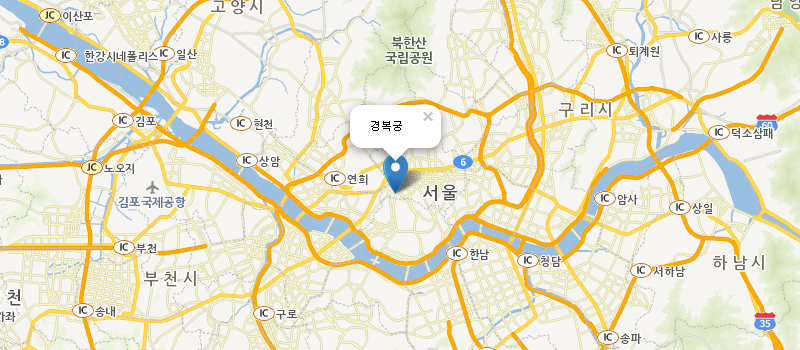
- 마커에 인포윈도우 생성
-
마커에 추가적인 정보를 표출하는 예제입니다.
인포윈도우(InfoWindow)는 지도 위의 특정 지점에 대한 상세정보를 제공하기 위한 용도로 사용합니다.
인포윈도우는 말풍선과 같은 형태를 가지며 정보를 기술하는 영역과 지도상의 특정 지점과 연결되는 말풍선 꼬리로 구성됩니다.
일반적으로 인포윈도우는 지도상의 특정지점 POI 상에 직접 출력되거나 마커 상단에 출력되는 형태를 가집니다.
인포윈도우의 생성은 생성된 마커 객체에 bindInfoWindow 함수로 바인딩을 하고, openInfoWindow 함수로 툴팁을 표출합니다.
bindInfoWindow 함수로 툴팁정보를 바인딩할 시 파라미터로 HTML 속성을 넣을 수 있으며, 자유롭게 커스터마이징 할 수 있습니다.
예제소스
</> 소스 예제 실행
					var map = sop.map('map');
					map.setView(sop.utmk(953427, 1950827), 5);
					var marker = sop.marker([953427, 1950827]);
					marker.addTo(map).bindInfoWindow("경복궁 ").openInfoWindow();
실행결과
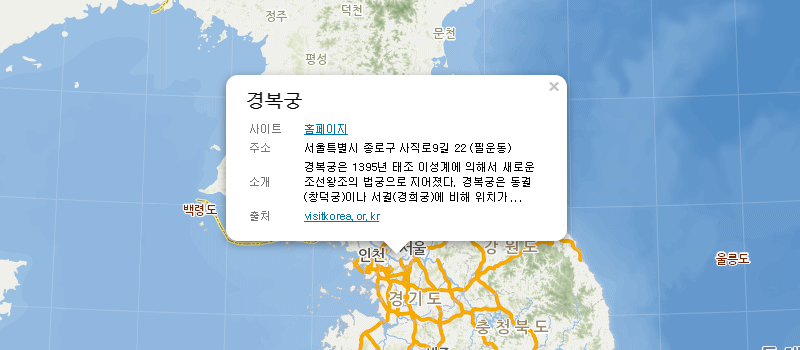
- 커스텀 인포윈도우 생성
-
커스텀 인포윈도우를 설정하는 예제입니다.
기본적으로 제공하는 인포윈도우 외에 HTML 을 이용하여
직접 컨텐츠를 생성후 setContent 속성을 사용하여 인포윈도우를 추가 생성 가능합니다.
또한, 위의 예처럼 bindInfoWindow 함수에서 HTML 속성을 넣어 생성할 수 있습니다.
예제소스
</> 소스 예제 실행
					var map = sop.map('map');
					map.setView(sop.utmk(953427, 1950827), 1);

					var infoWindow = sop.infoWindow();
					var contents =  "";
					 	contents += "<div style='font-family: dotum, arial, sans-serif;font-size: 18px; font-weight: bold;margin-bottom: 5px;'>경복궁"</div>";
					    contents += "<table style='border-spacing:2px;border:0px;'>";
					    contents += 	"<tbody>";
					    contents +=			"<tr>";
					 	contents +=	 			"<td style='width:40px;color:#767676;padding-right:12px'>사이트";
					  	contents +=				"<td>홈페이지";
					  	contents +=			"</tr>";
					  	contents +=			"<tr>";
					  	contents +=				"<td style='color:#767676;padding-right:12px'>주소";
					 	contents +=				"<td>서울특별시 종로구 사직로9길 22 (필운동)";
					 	contents +=			"</tr>";
					  	contents +=			"<tr>";
					  	contents +=				"<td style='color:#767676;padding-right:12px'>소개";
					  	contents +=				"<td>경복궁은 1395년 태조 이성계에 의해서 새로운 조선왕조의 법궁으로 지어졌다. 경복궁은 동궐(창덕궁)이나 서궐(경희궁)에 비해 위치가 ...";
					  	contents +=			"</tr>";
					  	contents +=			"<tr>";
					  	contents +=				"<td style='color:#767676;padding-right:12px'>출처";
					 	contents +=				"<td>visitkorea.or.kr";
					  	contents +=			"</tr>";
					  	contents +=		"</tbody>";
					  	contents += "</table>";

					infoWindow.setUTMK([953820, 1953437]);
					infoWindow.setContent(contents);
					infoWindow.openOn(map);
실행결과
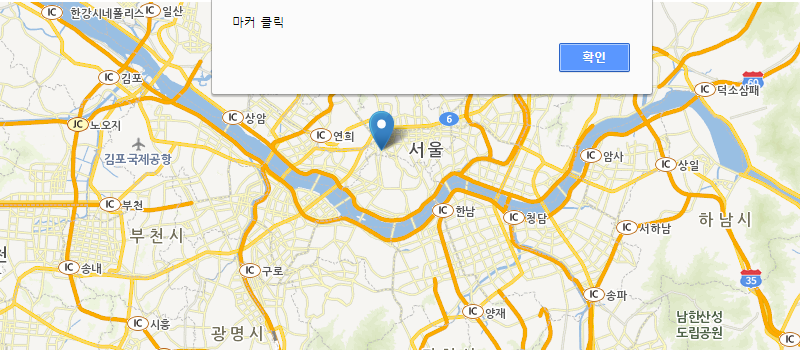
- 마커에 클릭 이벤트 등록
-
특정 마커에 클릭 이벤트를 생성하는 예제입니다.
생성된 마커에 click 이벤트를 다음과 같이 on 속성을 사용하여 등록이 가능 합니다.
예제소스
</> 소스 예제 실행
					var map = sop.map('map');
					map.setView(sop.utmk(953427, 1950827), 5);
					var marker = sop.marker([953427, 1950827]);
					marker.on("click",function(e){
					 alert("마커 클릭");
					});
					marker.addTo(map);
실행결과
- 마커 클러스터 생성
-
다수의 마커를 클러스터로 묶어서 표현하는 예제입니다.
특정 범위 안에 생성된 POI 마커를 markerClusterGroup 속성으로 설정하여 클러스터를 표현할 수 있습니다.
먼저, markerClusterGroup 레이어를 생성하고, 해당 레이어에 addLayer 함수를 이용하여 마커를 추가합니다.
markerClusterGroup 레이어는 여러개 생성할 수 있으며, 해당 레이어에 속한 마커들끼리 클러스터가 적용됩니다.
예제소스
</> 소스 예제 실행
					var map = sop.map('map');
					map.setView(sop.utmk(953427, 1950827), 5);
					var marker1 = sop.marker([953427, 1950827]);
					var marker2 = sop.marker([953427, 1950727]);
					var marker3 = sop.marker([953427, 1950627]);

					var markerList = sop.markerClusterGroup({
					 animateAddingMarkers: true
					});

					map.addLayer(markerList);
					markerList.addLayer(marker1);
					markerList.addLayer(marker2);
					markerList.addLayer(marker3);
실행결과
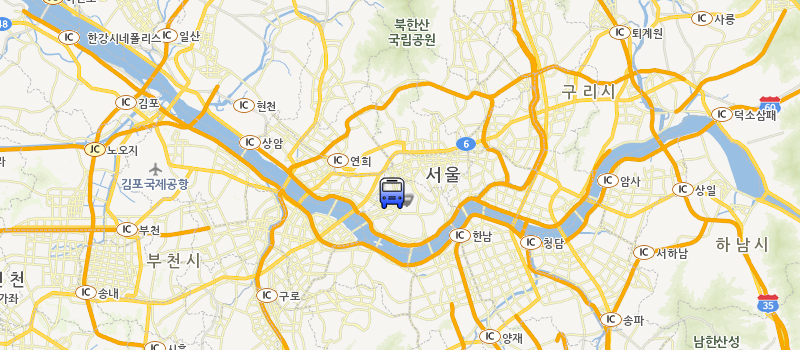
- 이미지 마커 생성
-
자신만의 마커 아이콘을 설정하는 예제입니다.
SOP JavaScript에서 제공하는 기본 아이콘 대신 표시할 아이콘을 정의할 수 있습니다.
화면상에 나타나는 아이콘 모양을 바꾸기 위한 많은 속성들이 있습니다.
이미지 마커를 생성하기 위해서는 sop.icon 을 이용해 마커의 기본적인 속성을 정의해야 합니다.
마커 이미지 경로, 마커 그림자이미지 경로, 이미지 사이즈, 툴팁팝업 위치 등의 여러 옵션들을 이용하여 이미지 마커를 생성합니다.
예제소스
</> 소스 예제 실행
					var map = sop.map('map');
					map.setView(sop.utmk(953427, 1950827), 5);
					var myIcon = sop.icon({
					    iconUrl: '/img/idm/bus.png',
					    shadowUrl: '/img/idm/bus-shadow.png',
					    iconSize:     [32, 32],
					    shadowSize:   [32, 32],
					    iconAnchor:   [22, 0],
					    shadowAnchor: [5, 0],
					    popupAnchor:  [-3, -76]
					});
					var marker = sop.marker([953427, 1950827], {icon: myIcon}); //마커 생성시 myIcon 옵션값이용 마커 생성
					marker.addTo(map); //마커를 map 추가
실행결과
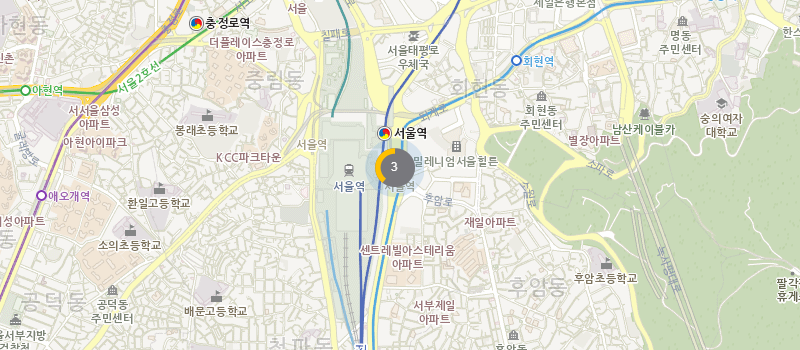
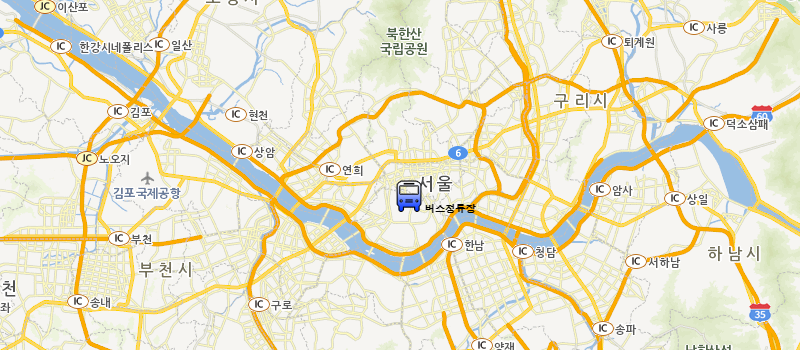
- 커스텀 마커 생성
-
기본 마커를 변경하는 기능의 예제입니다.
SOP JavaScript에서 제공하는 기본 아이콘 대신 sop.DivIcon을 이용하여 표시할 HTML로 마커를 표현 할 수 있습니다.
이 기능을 이용하여 간단한 이미지부터 차트같은 복잡한 기능까지 HTML로 만들 수 있는 어떤것이든 커스텀 마커로 생성할 수 있습니다.
예제소스
</> 소스 예제 실행
var map = sop.map('map');
var html = "";
html += " 버스정류장";
html += "";
var icon = new sop.DivIcon({html:html, className: "div_icon", iconSize: new sop.Point(7, 7), iconAnchor: new sop.Point(6,6), infoWindowAnchor: new sop.Point(1,-5)});
map.setView(sop.utmk(953427, 1950827), 5);
var marker = sop.marker([953427, 1950827], {
icon : icon
});
marker.addTo(map);
버스정류장";
html += "";
var icon = new sop.DivIcon({html:html, className: "div_icon", iconSize: new sop.Point(7, 7), iconAnchor: new sop.Point(6,6), infoWindowAnchor: new sop.Point(1,-5)});
map.setView(sop.utmk(953427, 1950827), 5);
var marker = sop.marker([953427, 1950827], {
icon : icon
});
marker.addTo(map);
실행결과
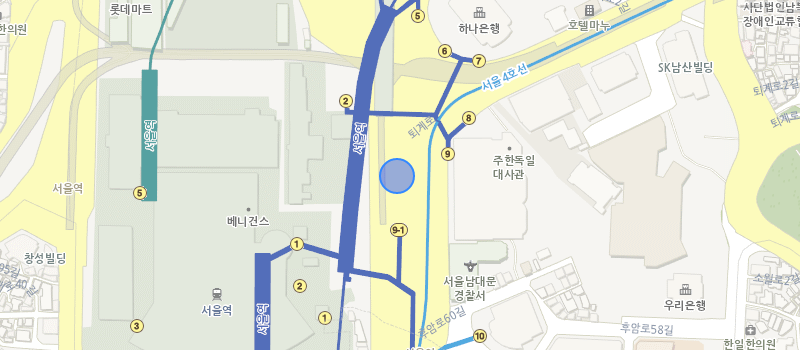
- 서클 마커 생성
-
원형 마커를 생성하는 기능의 예제입니다.
SOP JavaScript에서 제공하는 기본 아이콘 대신 서클 모양의 마커를 다음과 같이 옵션을 통해 생성 할 수 있습니다.
써클마커는 sop.circleMarker를 이용하며, 크기, 색상, 테두리 굵기 등을 옵션으로 설정할 수 있습니다.
예제소스
</> 소스 예제 실행
					var map = sop.map('map');
					map.setView(sop.utmk(953427, 1950827), 5);
					var marker = sop.circleMarker([953427, 1950827], {
					 radius : 17,
					 fillColor : "#03f",
					 weight : 2,
					});
					marker.addTo(map);
실행결과
- 마커 z-index 변경
-
겹쳐서 표시되는 마커의 위치 우선순위를 설정하는 예제입니다.
생성한 마커에 대한 index 값을 조정합니다.
zIndexOffset 속성을 이용하여 설정할 수 있으며, 숫자값이 높을수록 더 상위에 위치 하게 됩니다.
예제소스
</> 소스 예제 실행
					var map = sop.map('map');
					map.setView(sop.utmk(953427, 1950827), 5);
					var marker1 = sop.marker([953427, 1950827],{zIndexOffset : 3});
					var marker2 = sop.marker([953427, 1950827],{zIndexOffset : 2});
					var marker3 = sop.marker([953427, 1950827],{zIndexOffset : 1});

					marker1.addTo(map);
					marker2.addTo(map);
					marker3.addTo(map);
실행결과
- 폴리라인 생성
-
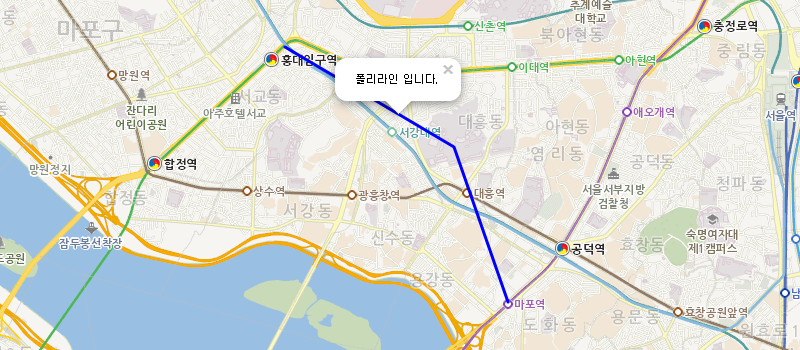
지도 위에 폴리라인을 생성하는 예제입니다.
폴리라인은 선으로 이루어진 도형을 지도위에 나타내기 위한 클래스입니다.
폴리라인은 빠른길 찾기 결과와 같이 특정 경로를 지도상에 보여주기 위해서 주로 사용됩니다.
다음 예제는 홍대입구역에서 마포역까지 이어지는 폴리라인을 생성하는 예제입니다.
폴리라인을 생성하기 위해서는 sop.polyline 을 이용하며, 파라미터에 좌표로 구성된 배열정보 와 라인을 시각화하기 위한 옵션정보 를 설정하여 폴리라인을 생성합니다.
폴리라인 옵션은 다음과 같은 속성들을 사용해서 폴리라인을 구성하는 선들을 색상, 두께 및 투명도를 지정할 수 있습니다.
color : '#FFFFFF' 형식의 16진수 HTML 색상 또는 색상에 대한 이름을 선의 색상으로 지정합니다.
weight : 선의 두께를 픽셀 단위로 정의합니다.
opacity : 선 색상의 투명도에 대해서 0.0 (완전 투명) 부터 1.0 (완전 불투명, 기본값) 사이의 숫자를 지정합니다.
예제소스
</> 소스 예제 실행
					var map = sop.map('map');
					map.setView(sop.utmk(953427, 1950827), 5);

					var polylines = [
					 [949279, 1951131],
					 [950631, 1950331],
					 [951063, 1949091]
					];

					var polyline = sop.polyline(polylines, {
					 stroke: true,
					 color: 'blue',
					 weight : 3,
					 opacity: 1,
					 fill: false,
					 fillColor:'blue',
					 fillOpacity: 0.2,
					});

					polyline.bindInfoWindow("폴리라인 입니다.");
					polyline.addTo(map);
					map.fitBounds(polyline);
실행결과
- 폴리곤 생성
-
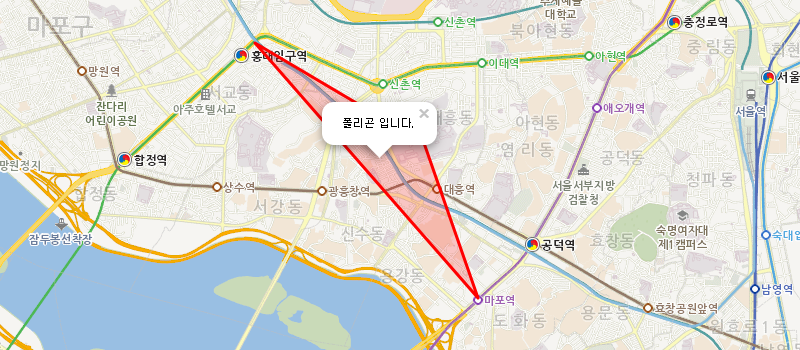
지도위에 특정한 직선으로 이루어진 도형을 표시하는 예제입니다.
폴리곤은 폴리라인과 마찬가지로 선으로 이루어진 도형을 표현합니다.
시작점과 끝점이 항상 연결되며 채우기를 지정할 수 있습니다.
폴리곤은 sop.polygon 을 이용하여 생성할 수 있습니다.
폴리곤을 구성하는 선들의 좌표는 다음과 같이 polygons 배열 좌표를 지정하여 정의됩니다.
다음 예제는 홍대입구역에서 마포역까지 이어지는 폴리곤을 생성합니다.
폴리곤 옵션은 다음과 같은 속성들을 사용해서 폴리곤을 구성하는 선들의 색상, 두께 및 투명도를 지정할 수 있습니다.
color : '#FFFFFF' 형식의 16진수 HTML 색상 또는 색상에 대한 이름을 선의 색상으로 지정합니다.
weight : 선의 두께를 픽셀 단위로 정의합니다.
opacity : 선 색상의 투명도에 대해서 0.0 (완전 투명) 부터 1.0 (완전 불투명, 기본값) 사이의 숫자를 지정합니다.
fillColor : 폴리곤의 내부를 채울 색상을 지정합니다.
fillOpacity : 폴리곤 내부 투명도에 대해서 0.0 (완전 투명) 부터 1.0 (완전 불투명, 기본값) 사이의 숫자를 지정합니다.
예제소스
</> 소스 예제 실행
					var map = sop.map("map"); //map 생성
					map.setView(sop.utmk(953427, 1950827), 5); // 지도 중심좌표로 뷰 설정
					//지도에 표시되는 폴리곤 데이터
					var polygons = [
					                                [
					                                    [949279, 1951131],
					                                    [950631, 1950331],
					                                    [951063, 1949091]
					                                ]
					                            ];
					//폴리곤 생성
					 var polygon = sop.polygon(polygons,
					{
					 stroke: true,
					 color: "red",
					 weight : 3,
					 opacity: 1,
					 fill: true,
					 fillColor:"red",
					 fillOpacity: 0.2
					});

					polygon.bindInfoWindow("폴리곤 입니다."); //인포 윈도우 바인드
					polygon.addTo(map); //지도에 폴리곤 추가
					map.fitBounds(polygon); ////fitBounds 최대 줌 레벨로 polygon데이터를 보여 줍니다
실행결과
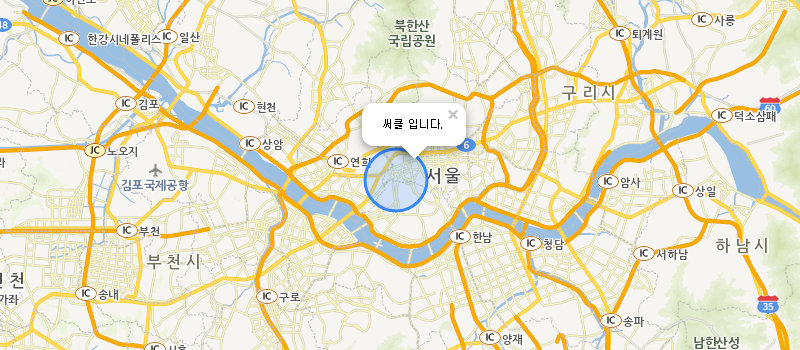
- 원 생성
-
지도위에 특정한 원을 표시하는 예제입니다.
원은 sop.circle 을 이용해서 생성할 수 있습니다.
원의 중심점은 원 객체 생성시 지도상의 좌표를 지정하고, 원의 반지름은 setRadius 사용해서 미터 단위로 지정할 수 있습니다.
원 옵션은 다음과 같은 속성들을 사용해서 원을 구성하는 선들의 색상, 두께 및 투명도를 지정할 수 있습니다.
color : '#FFFFFF' 형식의 16진수 HTML 색상 또는 색상에 대한 이름을 선의 색상으로 지정합니다.
weight : 선의 두께를 픽셀 단위로 정의합니다.
opacity : 선 색상의 투명도에 대해서 0.0 (완전 투명) 부터 1.0 (완전 불투명, 기본값) 사이의 숫자를 지정합니다.
fillColor : 원의 내부를 채울 색상을 지정합니다.
fillOpacity : 원 내부 투명도에 대해서 0.0 (완전 투명) 부터 1.0 (완전 불투명, 기본값) 사이의 숫자를 지정합니다.
예제소스
</> 소스 예제 실행
					var map = sop.map('map');
					map.setView(sop.utmk(953427, 1950827), 5);

					var circle = sop.circle([953335, 1950717]);
					circle.setRadius(2000);

					circle.bindInfoWindow("써클 입니다.");
					circle.addTo(map);
실행결과
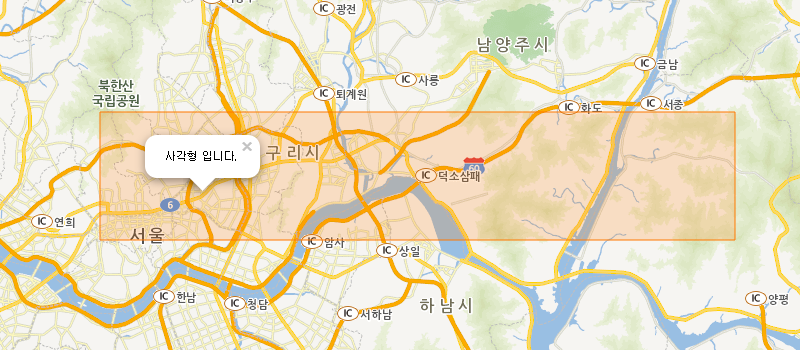
- 사각형 생성
-
지도위에 사각형을 표시하는 예제입니다.
사각형은 선으로 이루어진 사각형 도형을 표현합니다. 시작점과 끝점이 항상 연결되며 채우기를 지정할 수 있습니다.
사각형은 sop.rectangle 을 이용하여 좌표로 이루어진 배열정보 와 옵션정보를 설정하여 생성할 수 있습니다.
다음과 같은 속성들을 사용해서 사각형을 구성하는 선들의 색상, 두께 및 투명도를 지정할 수 있습니다.
color : '#FFFFFF' 형식의 16진수 HTML 색상 또는 색상에 대한 이름을 선의 색상으로 지정합니다.
weight : 선의 두께를 픽셀 단위로 정의합니다.
opacity : 선 색상의 투명도에 대해서 0.0 (완전 투명) 부터 1.0 (완전 불투명, 기본값) 사이의 숫자를 지정합니다.
fillColor : 사각형의 내부를 채울 색상을 지정합니다.
fillOpacity : 사각형 내부 투명도에 대해서 0.0 (완전 투명) 부터 1.0 (완전 불투명, 기본값) 사이의 숫자를 지정합니다.
예제소스
</> 소스 예제 실행
					var map = sop.map('map');
					map.setView(sop.utmk(953427, 1950827), 5);

					var rectangles = [
					       [953335, 1950717],
					       [993935, 1958917]
					   ];

					var rectangle = sop.rectangle(rectangles, {
					       color: "#ff7800",
					       weight: 1
					   });
					rectangle.bindInfoWindow("사각형 입니다.");
					rectangle.addTo(map);
실행결과
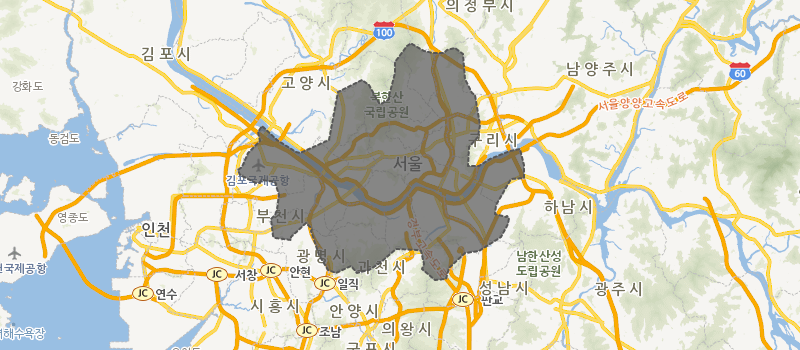
- GeoJSON
-
GeoJSON을 이용하는 예제입니다.
GeoJSON은 JavaScript Object Notation(JSON) 에 기반한 공간 데이터 교환 포맷(Geospatial Data Interchange Format)입니다.
GeoJSON은 다양한 지리데이터 구조를 인코딩하기 위한 포맷이며 Geometry, Feature, Feature Collection을 지원합니다.
예제소스
</> 소스 예제 실행
					var map = sop.map('map');
					map.setView(sop.utmk(953427, 1950827), 5);
					var geoData = {"type": "FeatureCollection", "features": [
					       {"type": "Feature", "geometry": {"type": "Polygon", "coordinates": [
					           [
					               [957648, 1966942],[959082, 1965955],[960333, 1965738],[961709, 1965784],[962036, 1966176],
					               [963128, 1966394],[964064, 1965652],[964428, 1962455],[965312, 1960690],[965702, 1960388],
					               [966315, 1956506],[966029, 1954964],[964926, 1953671],[964773, 1951259],[966144, 1951253],
					               [966649, 1951724],[967634, 1952167],[970119, 1953213],[971362, 1953481],[971875, 1951424],
					               [971981, 1949739],[970247, 1949573],[968323, 1946314],[968281, 1945191],[968675, 1944965],
					               [969636, 1944792],[969737, 1944923],[970068, 1944607],[969921, 1943869],[968999, 1942191],
					               [966170, 1940397],[964345, 1940121],[962383, 1938222],[961997, 1936853],[960517, 1936761],
					               [958928, 1938129],[959077, 1938697],[958928, 1939913],[958779, 1940422],[958424, 1940575],
					               [955537, 1940643],[953478, 1938848],[952074, 1937952],[950607, 1937646],[949824, 1938556],
					               [947877, 1937655],[946815, 1937968],[945715, 1939863],[944616, 1942967],[944828, 1943270],
					               [944089, 1943965],[942163, 1942199],[942112, 1941820],[940060, 1942052],[939850, 1942301],
					               [939583, 1944502],[940035, 1944970],[940290, 1945653],[940542, 1947533],[940116, 1949254],
					               [938413, 1949533],[938101, 1949120],[937604, 1949135],[935619, 1950179],[935318, 1950789],
					               [935796, 1951149],[936659, 1952928],[937634, 1953813],[938095, 1954545],[937944, 1955684],
					               [938376, 1956365],[938697, 1956256],[940307, 1954643],[942686, 1953113],[943281, 1952998],
					               [944891, 1953539],[947014, 1954664],[948177, 1960790],[951230, 1962308],[952080, 1961600],
					               [953135, 1960044],[953393, 1959333],[953653, 1959260],[954495, 1959778],[955367, 1963192],
					               [955367, 1964647],[956974, 1966631],[957326, 1966942],[957648, 1966942]
					           ]
					       ]}, "properties": {"Name": "11", "Description": "서울특별시"}}
					   ]};

					sop.geoJson(geoData, {
					 style: function () {
					  return {
					   weight: 2,
					   opacity: 1,
					   color: '#565656',
					   dashArray: '3',
					   fillOpacity: 0.7
					  };
					 },
					 onEachFeature: function (feature, layer) {
					  layer.bindInfoWindow(feature.properties.Description);
					 }
					}).addTo(map);
실행결과
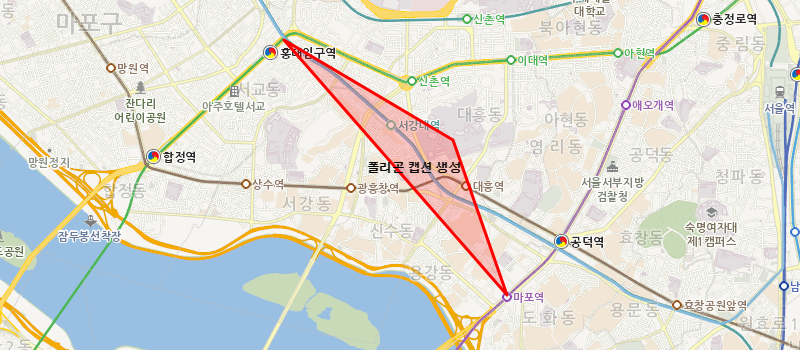
- 폴리곤 캡션 생성
-
지도위의 도형에 캡션을 생성하는 예제입니다.
생성된 폴리곤의 가운데에 setCaption 속성을 사용하여 캡션을 삽입 할 수 있습니다.
예제소스
</> 소스 예제 실행
					var map = sop.map("map"); //map 생성
					map.setView(sop.utmk(953427, 1950827), 5); // 지도 중심좌표로 뷰 설정
					//지도에 표시되는 폴리곤 데이터
					var polygons = [
					     [
					      [949279, 1951131],
					      [950631, 1950331],
					      [951063, 1949091]
					     ]
					    ];
					//폴리곤 생성
					 var polygon = sop.polygon(polygons, {
					   stroke: true,
					  color: "red",
					  weight : 3,
					  opacity: 1,
					  fill: true,
					  fillColor:"red",
					  fillOpacity: 0.2
					 });
					polygon.addTo(map); //지도에 폴리곤 추가
					polygon.setCaption({title:"폴리곤 캡션 생성", color:"black"});
					map.fitBounds(polygon); ////fitBounds 최대 줌 레벨로 polygon데이터를 보여 줍니다
실행결과
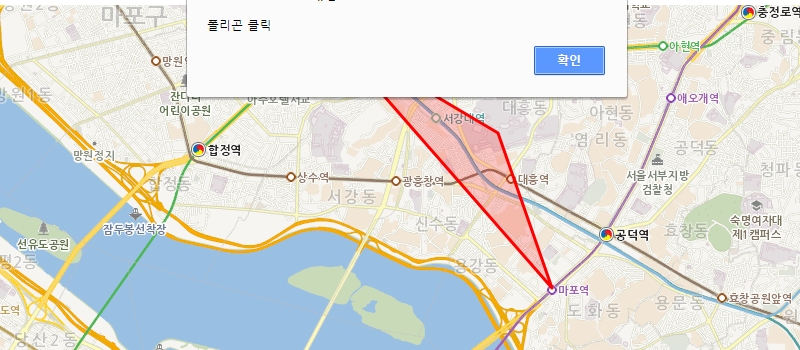
- 폴리곤 이벤트 생성
-
지도 위에 생성된 임의의 도형 클릭시 이벤트를 발생시키는 예제입니다.
생성된 폴리곤에 대한 이벤트는 일반적인 이벤트 등록 방법처럼 on 을 사용하여 등록 할수 있습니다.
예제소스
</> 소스 예제 실행
					var map = sop.map("map"); //map 생성
					map.setView(sop.utmk(953427, 1950827), 5); // 지도 중심좌표로 뷰 설정
					//지도에 표시되는 폴리곤 데이터
					var polygons = [
					     [
					      [949279, 1951131],
					      [950631, 1950331],
					      [951063, 1949091]
					     ]
					    ];
					//폴리곤 생성
					 var polygon = sop.polygon(polygons, {
					   stroke: true,
					  color: "red",
					  weight : 3,
					  opacity: 1,
					  fill: true,
					  fillColor:"red",
					  fillOpacity: 0.2
					 });
					polygon.on("click",function(e){alert("폴리곤 클릭");}); //polygon에 대한 이벤트 등록
					polygon.addTo(map); //지도에 폴리곤 추가
					map.fitBounds(polygon); ////fitBounds 최대 줌 레벨로 polygon데이터를 보여 줍니다
실행결과
- KML
-
KML을 이용하는 예제입니다.
KML 은 Google 어스, Google 지도와 같은 어스 브라우저에서 지리 데이터를 표시하는 데 사용되는 파일 형식으로 XML표준을 기반으로 합니다.
지도 API에서는 KML을 활용하여 위치 표시, 다각형 및 경로를 표시 할 수 있습니다.
대표적인 지원 태그로는 Placemark, Point, LineString, LinearRing, Polygon 등이 있습니다.
아래 예제는 KML파일을 이용하여 지도를 표시한 예제입니다.
예제소스
</> 소스 예제 실행
					var mapOptions = {
							  statisticTileLayer: true
							 };
							 var map = sop.map('map',mapOptions);
							 map.setView([953427, 1950827], 5);

							 var runLayer = sop.kml('/upload/myData/sample.kml')
							  .on('ready', function(e) {
							   map.fitBounds(runLayer.getBounds());
							  }).addTo(map);
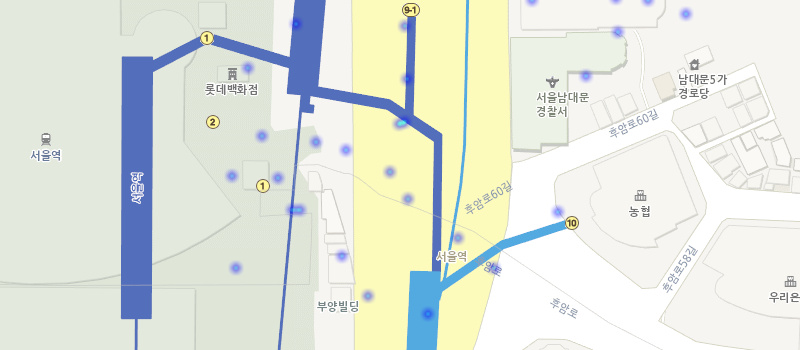
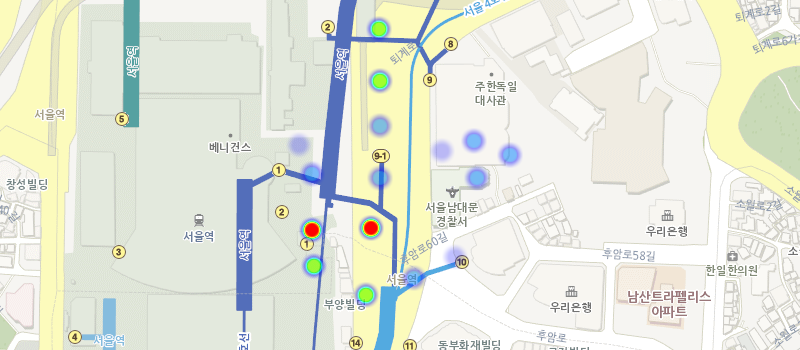
- 히트맵
-
열지도 기능을 이용하는 예제입니다.
히트맵(heatmap)은 열을 뜻하는 히트(heat)와 지도를 뜻하는 맵(map)을 결합시킨 단어로,
색상으로 표현할 수 있는 다양한 정보를 지도타일 위에 열분포 형태의 비쥬얼한 그래픽으로 데이터를 출력하는 것이 특징입니다.
히트맵은 sop.heatLayer 에 좌표로 구성된 배열정보와 투명도, 반지름, 흐림도 등과 같은 옵션정보를 설정하여 생성할 수 있습니다.
예제소스
</> 소스 예제 실행
					var map, totalCnt, heatDatas;
					heatDatas = [
					    [ 953424,  1950945.5],
					    [ 953427,  1950919],
					    [ 953429.5,  1950884],
					    [ 953429,  1950842.5],
					    [ 953429.5,  1950812],
					    [ 953426.5,  1950765],
					    [ 953426.5,  1950717],
					    [ 953428,  1950678.5],
					    [ 953424.5,  1950898.5],
					    [ 953426,  1950868],
					    [ 953428.5,  1950835],
					    [ 953425.5,  1950795.5],
					    [ 953427.5,  1950738.5],
					    [ 953423.5,  1950716],
					    [ 953419,  1950692],
					    [ 953372,  1950766],
					    [ 953355,  1950710],
					    [ 953370,  1950673],
					    [ 953395,  1950650],
					    [ 953408,  1950630],
					    [ 953397,  1950703],
					    [ 953382,  1950707],
					    [ 953374,  1950673],
					    [ 953453,  1950659],
					    [ 953503,  1950672],
					    [ 953517,  1950740],
					    [ 953533,  1950762],
					    [ 953490,  1950778],
					    [ 953511,  1950798],
					    [ 953532,  1950779],
					    [ 953548,  1950778],
					    [ 953567,  1950771],
					    [ 953471,  1950644],
					    [ 953438,  1950621],
					    [ 953342,  1950644],
					    [ 953363,  1950689],
					    [ 953340,  1950690],
					    [ 953348,  1950744],
					    [ 953347,  1950784]
					];

					map = sop.map('map');
					map.setView([ 953427, 1950827 ], 13);

					var heat = sop.heatLayer(heatDatas).addTo(map);
					heat.setOptions({
					    minOpacity : 0.01,
					    radius : 5,
					    blur : 5,
					    max : 1
					});
실행결과
- 마커 투명도 조절
-
지도 위 마커의 투명도를 조절하는 기능의 예제입니다.
생성된 마커에 opacity 속성을 적용하여 투명도를 조절할 수 있습니다.
예제소스
</> 소스 예제 실행
					var map = sop.map('map');
					map.setView(sop.utmk(953427, 1950827), 8);
					var marker1 = sop.marker([953425, 1950124],{opacity : 0});
					var marker2 = sop.marker([953422, 1950423],{opacity : 0.5});
					var marker3 = sop.marker([953427, 1950827],{opacity : 1});

					marker1.addTo(map);
					marker2.addTo(map);
					marker3.addTo(map);

					marker1.setOpacity(0.7);
실행결과
- 마커 이미지 변경
-
SOP 제공 마커 이미지를 변경하는 기능의 예제입니다.
이미지 마커가 아닌 기본 SOP에서 지원하는 '기본 마커'로 생성된 마커에 대한 이미지를 변경할 수 있습니다.
예제소스
</> 소스 예제 실행
					var map = sop.map('map');
					map.setView(sop.utmk(953427, 1950827), 5);
					var marker = sop.marker([953427, 1950127]);
					marker.addTo(map);
					marker._icon.src = "/img/tech/ico_supply_marker01.png";
실행결과
- 열지도 반지름/투명도 조절
-
지도 위의 열지도 속성을 조절하는 기능의 예제입니다.
생성된 열지도의 반지름 radius 투명도 minOpacity를 setOptions 속성을 통하여 조절 할 수 있습니다.
예제소스
</> 소스 예제 실행
					var map, totalCnt, heatDatas;
					heatDatas = [
					    [ 953424,  1950945.5],
					    [ 953427,  1950919],
					    [ 953429.5,  1950884],
					    [ 953429,  1950842.5],
					    [ 953429.5,  1950812],
					    [ 953426.5,  1950765],
					    [ 953426.5,  1950717],
					    [ 953428,  1950678.5],
					    [ 953424.5,  1950898.5],
					    [ 953426,  1950868],
					    [ 953428.5,  1950835],
					    [ 953425.5,  1950795.5],
					    [ 953427.5,  1950738.5],
					    [ 953423.5,  1950716],
					    [ 953419,  1950692],
					    [ 953372,  1950766],
					    [ 953355,  1950710],
					    [ 953370,  1950673],
					    [ 953395,  1950650],
					    [ 953408,  1950630],
					    [ 953397,  1950703],
					    [ 953382,  1950707],
					    [ 953374,  1950673],
					    [ 953453,  1950659],
					    [ 953503,  1950672],
					    [ 953517,  1950740],
					    [ 953533,  1950762],
					    [ 953490,  1950778],
					    [ 953511,  1950798],
					    [ 953532,  1950779],
					    [ 953548,  1950778],
					    [ 953567,  1950771],
					    [ 953471,  1950644],
					    [ 953438,  1950621],
					    [ 953342,  1950644],
					    [ 953363,  1950689],
					    [ 953340,  1950690],
					    [ 953348,  1950744],
					    [ 953347,  1950784]
					];

					map = sop.map('map');
					map.setView([ 953427, 1950827 ], 13);

					var heat = sop.heatLayer(heatDatas).addTo(map);
					heat.setOptions({
					    minOpacity : 0.01,
					    radius : 1,
					    blur : 5,
					    max : 1
					});

					function radiusChange(val){
						console.log(val);
						heat.setOptions({
						    minOpacity : 0.01,
						    radius : val,
						    blur : 5,
						    max : 1
						});
					}
실행결과
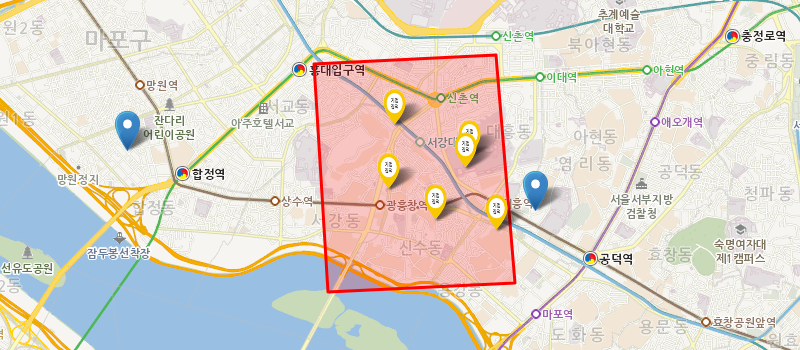
- 폴리곤에 포함된 마커 찾기
-
지도 위 표시된 폴리곤 영역 안의 특정 마커를 찾는 예제입니다.
폴리곤 영역 내 좌표에 속하는 마커를 찾아낼 수 있습니다.
getBounds 함수로 폴리곤의 영역을 가져온 다음, contains 함수로 폴리곤에 속해있는 좌표인지를 편별할 수 있습니다.
예제소스
</> 소스 예제 실행
					var map = sop.map("map"); //map 생성
					map.setView(sop.utmk(953427, 1950827), 5); // 지도 중심좌표로 뷰 설정
					//지도에 표시되는 폴리곤 데이터
					 var polygons = [
					  [
					   [949290,1951077],
					   [950746,1951149],
					   [950898,1949325],
					   [949402,1949253]
					  ]
					 ];


					//폴리곤 생성
					 var polygon = sop.polygon(polygons, {
					   stroke: true,
					  color: "red",
					  weight : 3,
					  opacity: 1,
					  fill: true,
					  fillColor:"red",
					  fillOpacity: 0.2
					 });
					polygon.addTo(map); //지도에 폴리곤 추가
					map.fitBounds(polygon); ////fitBounds 최대 줌 레벨로 polygon데이터를 보여 줍니


					map.on("contextmenu",function(e) {
					  setTimeout(function() {
					   var x_coor = e.utmk.x;
					   var y_coor = e.utmk.y;
					   console.log(x_coor);
					   console.log(y_coor);
					  }, 200);

					 });


					var markerList = new Array();

					var markerXY = [
					    [951054,1949891],
					    [950500,1950219],
					    [950748,1949727],
					    [949930,1950567],
					    [950526,1950317],
					    [949882,1950053],
					    [950260,1949803],
					    [947794,1950377]
					    ];

					for(var i = 0; i < markerXY.length; i ++){
					 var marker = sop.marker([ markerXY[i][0], markerXY[i][1]]);
					 markerList.push(marker);
					 marker.addTo(map);
					}

					 for(var i = 0; i < markerList.length; i++){
					 if(polygon.getBounds().contains([ markerXY[i][0], markerXY[i][1]])){
						 markerList[i]._icon.src = "/img/tech/ico_supply_marker01.png";
					 }
					}
실행결과
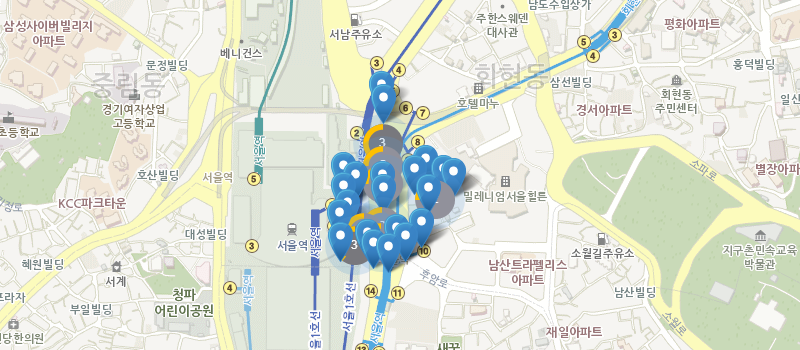
- 마커 클러스터 반경설정
-
지도 위 복수의 마커를 묶어 표현하는 예제입니다.
특정 범위 안에 생성된 POI 마커를 클러스터로 묶어서 지도상에 표현 할 수 있습니다.
maxClusterRadius 속성으로 묶을 범위를 지정해 줍니다.
예제소스
</> 소스 예제 실행
					var map = sop.map('map');
					map.setView(sop.utmk(953427, 1950827), 5);
					var markerList = new Array();
					var markerClusterList = null;

					var markerDataList = [
					    [ 953424,  1950945.5],
					    [ 953427,  1950919],
					    [ 953429.5,  1950884],
					    [ 953429,  1950842.5],
					    [ 953429.5,  1950812],
					    [ 953426.5,  1950765],
					    [ 953426.5,  1950717],
					    [ 953428,  1950678.5],
					    [ 953424.5,  1950898.5],
					    [ 953426,  1950868],
					    [ 953428.5,  1950835],
					    [ 953425.5,  1950795.5],
					    [ 953427.5,  1950738.5],
					    [ 953423.5,  1950716],
					    [ 953419,  1950692],
					    [ 953372,  1950766],
					    [ 953355,  1950710],
					    [ 953370,  1950673],
					    [ 953395,  1950650],
					    [ 953408,  1950630],
					    [ 953397,  1950703],
					    [ 953382,  1950707],
					    [ 953374,  1950673],
					    [ 953453,  1950659],
					    [ 953503,  1950672],
					    [ 953517,  1950740],
					    [ 953533,  1950762],
					    [ 953490,  1950778],
					    [ 953511,  1950798],
					    [ 953532,  1950779],
					    [ 953548,  1950778],
					    [ 953567,  1950771],
					    [ 953471,  1950644],
					    [ 953438,  1950621],
					    [ 953342,  1950644],
					    [ 953363,  1950689],
					    [ 953340,  1950690],
					    [ 953348,  1950744],
					    [ 953347,  1950784]
					];


					function addLayer(val){

						markerClusterList = sop.markerClusterGroup({
							 animateAddingMarkers: true,
							 maxClusterRadius : val
						});
						map.addLayer(markerClusterList);

						for(var i = 0; i < markerDataList.length; i++ ){
							var marker = sop.marker([markerDataList[i][0], markerDataList[i][1]]);
							markerList.push(marker);
							markerClusterList.addLayer(marker);
						}
					}

					function removeLayer(){
						map.removeLayer(markerClusterList);
					}

					function refreashMap(val){
						removeLayer();
						addLayer(val);
					}

					addLayer(10)
실행결과
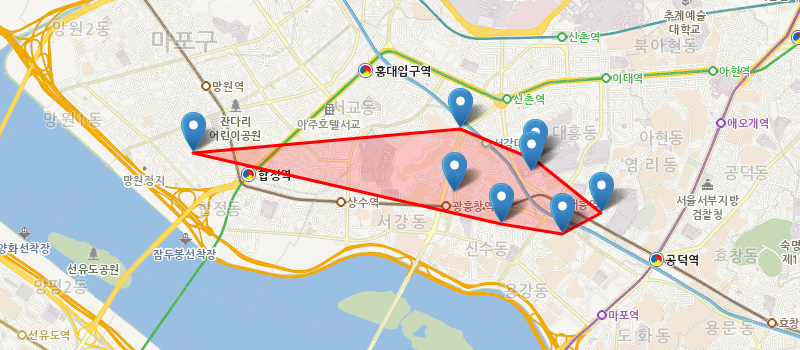
- 여러 개의 마커중 최외각 마커의 폴리곤 생성
-
지도 위의 마커를 이용하여 폴리곤을 생성하는 예제입니다.
여러 개의 마커들 중에서 최외각 마커를 찾을 때 유용하게 사용될 수 있습니다.
sop.QuickHull 클래스의 getConvexHull 함수를 이용하여 최외각 좌표를 찾을 수 있습니다.
리턴된 좌표들을 이용하여 폴리곤을 생성합니다.
예제소스
</> 소스 예제 실행
					var map = sop.map("map"); //map 생성
					map.setView(sop.utmk(953427, 1950827), 5); // 지도 중심좌표로 뷰 설정
					var markerList = new Array();
					var markerXY = [
									[951054,1949891],
									[950500,1950219],
									[950748,1949727],
									[949930,1950567],
									[950526,1950317],
									[949882,1950053],
									[950260,1949803],
									[947794,1950377]
									];

					var markerObjectList = new Array();

					for(var i = 0; i < markerXY.length; i ++){
						var marker = sop.marker([ markerXY[i][0], markerXY[i][1]]);
						markerList.push(marker);
						marker.addTo(map);
						markerObjectList.push({x:markerXY[i][0], y:markerXY[i][1] });
					}

					var point = sop.QuickHull.getConvexHull(markerObjectList);
					var polygon = sop.polygon(point, {
					 	stroke: true,
						color: "red",
						weight : 3,
						opacity: 1,
						fill: true,
						fillColor:"red",
						fillOpacity: 0.2
					});

					polygon.addTo(map); //지도에 폴리곤 추가
					map.fitBounds(polygon); ////fitBounds 최대 줌 레벨로 polygon데이터를 보여 줍니다.
실행결과
- 서클 마커 설정
-
지도 위의 원형 마커 속성을 지정하는 예제입니다.
생성된 서클 마커에 대한 투명도를 fillOpacity 속성을 이용하여 다음과 같이 지정 할 수 있습니다.
예제소스
</> 소스 예제 실행
					var map = sop.map('map');
					map.setView(sop.utmk(953427, 1950827), 5);
					var marker = sop.circleMarker([953427, 1950827], {
					 radius : 17,
					 fillColor : "#03f",
					 fillOpacity : 1,
					 weight : 2,
					});
					marker.addTo(map);

					function markerColorChange(){
					  var letters = '0123456789ABCDEF'.split('');
					     var color = '#';
					     for (var i = 0; i < 6; i++ ) {
					         color += letters[Math.floor(Math.random() * 16)];
					     }

					     marker.setStyle({
					   fillColor : color,
					   color : color
					  });
					}

					function markerOpacityChange(val){
					 console.log(val);
					 marker.setStyle({
					  fillOpacity : val
					 });
					}
실행결과
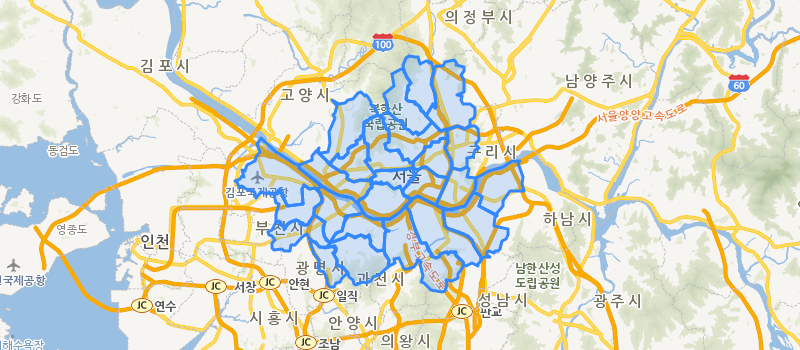
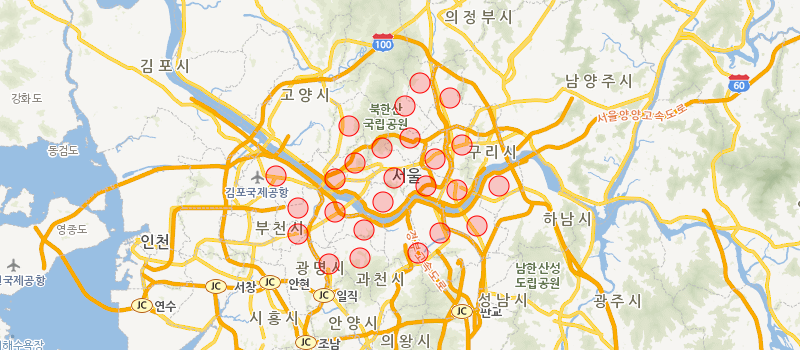
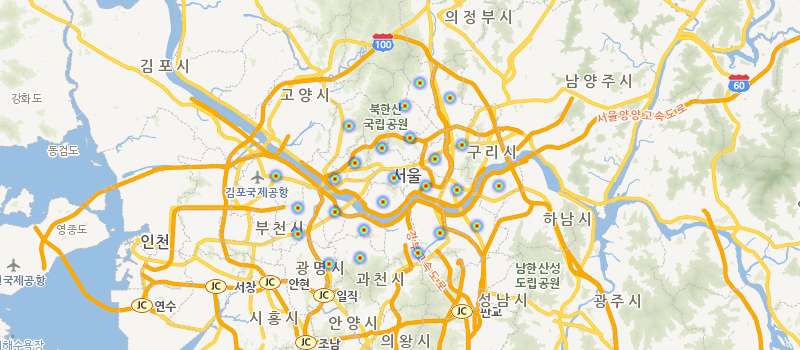
- 데이터 시각화(색상지도, 버블지도, 점지도, 열지도)
-
데이터를 시각적으로 표현하는 예제입니다.
생성된 지도에 대하여 OpenAPI를 통해 경계와 데이터를 색상과 원등으로 표현할 수 있습니다.
예제소스
</> 소스 예제 실행
var legendColor = ["#ccc", "#c2b5b9", "#b99ea6", "#b08893", "#a77180", "#9e5a6d", "#95445a", "#8c2d47", "#831634", "#7a0021"];
var legendCircleRadius = [10, 15, 20, 25, 30, 35, 40, 45, 50, 55];
var circleMarkerList = null;
var heat = null;
var map, mapOptions, oriArea, sopArea, logger, divConsole;
logger = divLogger();
mapOptions = {
ollehTileLayer: true,
measureControl: false,
zoomSliderControl: false,
panControl: false,
attributionControl: false
};
map = sop.map("map", mapOptions);
map.setView([953427, 1950827], 0);
function tokenKeySetting(){
accessToken = $("#tokenKey").val();
}
function createServiceRequest(reqFunc, reqParam) {
return function () {
// 인증 API
$.ajax({
url : 'https://sgisapi.kostat.go.kr/OpenAPI3/auth/authentication.json' +
'?consumer_key='+consumer_key+'&consumer_secret='+consumer_secret,
type : 'get',
success: function (res, status) {
reqParam.accessToken = res.result.accessToken;
reqFunc(reqParam);
}
});
}
}
sop.DomUtil.get("clear").onclick = clear;
divConsole = sop.DomUtil.get("divCon");
function addArea(type) {
if($("#tokenKey").val() == ""){
alert("키를 입력해주세요");
return;
}
clear();
var year = "2010";
var adm_cd = "11";
$.ajax({
url : 'https://sgisapi.kostat.go.kr/OpenAPI3/boundary/hadmarea.geojson' +
'?accessToken='+ accessToken +'&year='+year+'&adm_cd='+adm_cd,
type : 'get',
datatype : "geojson",
success: function( res,status) {
oriArea = res;
if(type=="color"){
sopArea = sop.geoJson(res).addTo(map);
map.fitBounds(sopArea.getBounds());
}else if(type=="bubble" || type=="dot" || type=="heat"){
circleMarkerList = makeCircleList(res);
}
logger("경계조회 결과");
logger("" + JSON.stringify(res, null, 2) + "
");
},
complete : function(){
addStatistic(type);
},
});
}
function addStatistic(type) {
if (!oriArea) {
alert("경계조회를 먼저 하세요");
return;
}
var year = "2010";
var adm_cd = "11";
var low_search = "1";
$.ajax({
url : 'https://sgisapi.kostat.go.kr/OpenAPI3/stats/population.json' +
'?accessToken='+accessToken+'&year='+year+'&adm_cd='+adm_cd+
'&low_search=' +low_search,
type : 'get',
success: function (res,status) {
// 맵형태로 변환 한다.
var idx, len, target, conComplite = {}, key, value, strToolTip;
target = res.result;
for (idx = 0, len = target.length; idx < len; idx ++) {
conComplite[target[idx].adm_cd] = target[idx];
}
var objectList = new Array();
logger("----------- [ 가구통계 조회 성공 ] -----------");
logger("" + JSON.stringify(res, null, 2) + "
");
if(type=="color"){
sopArea.eachLayer(function (layer) {
key = layer.feature.properties.adm_cd;
value = conComplite[key];
if (!value) { return; }
strToolTip = "지역(구)명 : " + value.adm_nm + "
";
strToolTip += "총인구 : " + value.tot_ppltn + "
";
strToolTip += "ADM : " + key + "
";
layer.bindToolTip(strToolTip);
var object = new Object();
object.value = value.tot_ppltn;
object.admCd = key;
objectList.push(object);
});
}else if(type == "bubble" || type == "dot" || type == "heat"){
for(var i = 0; i < circleMarkerList.length; i++){
var infos = circleMarkerList[i].options.infos;
key = infos.adm_cd;
value = conComplite[key];
if (!value) { return; }
strToolTip = "지역(구)명 : " + value.adm_nm + "
";
strToolTip += "총인구 : " + value.tot_ppltn + "
";
strToolTip += "ADM : " + key + "
";
circleMarkerList[i].options.tooltipMsg = strToolTip;
circleMarkerList[i].bindInfoWindow(circleMarkerList[i].options.tooltipMsg);
var object = new Object();
object.value = value.tot_ppltn;
object.admCd = key;
objectList.push(object);
}
}
var legend = calculateLegend(objectList);
if(type=="color"){
areaFillColor(objectList,legend);
}else if(type == "bubble"){
circleMarkerList = areaSizeCircle(objectList,legend,circleMarkerList);
gridCirCle(circleMarkerList);
}else if(type == "dot"){
gridCirCle(circleMarkerList);
}else if(type == "heat"){
circleMarkerList = areaSizeCircle(objectList,legend,circleMarkerList);
addHeatMap(circleMarkerList);
}
}
});
}
function clear() {
if (sopArea) {
sopArea.remove();
}
if(heat !=null){
map.removeLayer(heat);
}
if(circleMarkerList !=null){
for(var i =0; i < circleMarkerList.length; i ++){
circleMarkerList[i].remove();
}
}
sopArea = undefined;
oriArea = undefined;
divConsole.innerHTML = "";
logger("------------- 지도초기화 완료 -------------");
}
function divLogger() {
var lineNum = 0;
var prefix = "";
return function (str) {
prefix = lineNum++ + " : ";
str = prefix + str;
if (divConsole.innerHTML.length < 300000) {
divConsole.innerHTML += str;
} else {
divConsole.innerHTML = str;
}
divConsole.innerHTML += "
";
divConsole.scrollTop = divConsole.scrollHeight;
};
}
function areaFillColor(objectList,legend){
sopArea.eachLayer(function (layer) {
var admCd = layer.feature.properties.adm_cd;
for(var i =0; i < objectList.length; i++){
if(objectList[i].admCd == admCd){
if(legend[legend.length-1] <= objectList[i].value){
layer.setStyle({
weight : 3,
color : legendColor[legend.length-1],
fillColor :legendColor[legend.length-1]
});
}else{
for(var j=0; j < legend.length; j ++){
if(legend[j] >= objectList[i].value){
layer.setStyle({
weight : 3,
color : legendColor[j],
fillColor :legendColor[j]
});
break;
}
}
}
}
}
});
}
function areaSizeCircle(objectList,legend,circleMarkerList){
//options.radius
for(var i = 0; i < circleMarkerList.length; i++){
if(legend[legend.length-1] <= objectList[i].value){
circleMarkerList[i].setStyle({
color : legendColor[legend.length-1],
fillColor : legendColor[legend.length-1],
radius : legendCircleRadius[legend.length-1]
});
}else{
for(var j = 0; j < legend.length; j++){
if(legend[j] >= objectList[i].value){
circleMarkerList[i].setStyle({
color : legendColor[j],
fillColor : legendColor[j],
radius : legendCircleRadius[j]
});
break;
}
}
}
}
return circleMarkerList;
}
function gridCirCle(circleList){
for(var i =0; i < circleList.length; i++){
circleList[i].addTo(map);
}
}
function makeCircleList(geoData){
var features = geoData.features;
var markerList = new Array();
for(var i =0; i < features.length; i ++){
var marker = sop.circleMarker([features[i].properties.x, features[i].properties.y], {
radius : legendCircleRadius[0],
fillColor : "red",
color : "red",
weight : 1,
tooltipMsg : "",
infos : {
idx : i,
adm_cd : features[i].properties.adm_cd,
adm_nm : features[i].properties.adm_nm,
data : "",
}
});
markerList.push(marker);
}
return markerList;
}
function addHeatMap(circleList){
heat = sop.heatLayer();
heat.addTo(map);
heat.setOptions({
minOpacity : 0.01,
radius : 5,
blur : 5,
max : 1
});
var xyList = new Array();
for(var i =0; i < circleList.length;i++){
xyList[i] = [circleList[i]._utmk.x,circleList[i]._utmk.y];
console.log(circleList[i]._radius);
heat.addUTMK([circleList[i]._utmk.x,circleList[i]._utmk.y,(circleList[i]._radius * 100000)]);
}
}
function calculateLegend(list){
if(list == null || list.length == 0){
return;
}
var arData = new Array();
arData[0] = new Array();
for(var i = 0; i < list.length; i++){
arData[0].push(list[i].value);
}
var legendValue = new Object();
legendValue.equal = [];
legendValue.auto = [];
var tmpData = [];
for (var i=0; i < arData.length; i++) {
var tmpData = arData[i];
for (var x=0; x < tmpData.length; x++) {
tmpData[x] = parseFloat(parseFloat(tmpData[x]).toFixed(2));
}
}
return calEqualLegend(arData);
}
function calEqualLegend(arData){
var equalMin, equalMax;
var tmpValPerSlice = [];
for ( var k = 0; k < arData.length; k++) {
if (arData[k].length == 1) {
var data = arData[k][0];
var tmpResult = new Array();
for ( var x = 0; x < 10; x++) {
var value = data+(data*x);
tmpResult.push(parseFloat(parseFloat(value).toFixed(2)));
}
tmpValPerSlice[k] = tmpResult;
}else {
var min = Math.min.apply(null, arData[k]);
var max = Math.max.apply(null, arData[k]);
equalMin = min;
equalMax = max;
var result = (max - min) / (10);
if (result == 0 && min != max) {
result = 1;
}
var tmpResult = new Array();
for ( var y=0; y <10; y++) {
if (result == 1 && min != max) {
tmpResult.push(result);
}else {
tmpResult.push(parseFloat(parseFloat((min+result * y)).toFixed(2))); //그래서 303 + 57*
}
}
tmpValPerSlice[k] = tmpResult;
}
}
return tmpValPerSlice[0];
}
실행결과
- 폴리곤에 캡션적용
-
지도 위 폴리곤에 설명 등을 덧붙이는 예제입니다.
생성된 폴리곤에 setCaption 속성을 이용하여 캡션을 지정할 수 있습니다.
예제소스
</> 소스 예제 실행
					var map = sop.map("map"); //map 생성
					map.setView(sop.utmk(953427, 1950827), 5); // 지도 중심좌표로 뷰 설정
					//지도에 표시되는 폴리곤 데이터
					var polygons = [
					     [
					      [949279, 1951131],
					      [950631, 1950331],
					      [951063, 1949091]
					     ]
					    ];
					//폴리곤 생성
					 var polygon = sop.polygon(polygons, {
					   stroke: true,
					  color: "red",
					  weight : 3,
					  opacity: 1,
					  fill: true,
					  fillColor:"red",
					  fillOpacity: 0.2
					 });
					 polygon.addTo(map); //지도에 폴리곤 추가
					polygon.setCaption({title:"폴리곤 캡션 생성", color:"black"});
					map.fitBounds(polygon); ////fitBounds 최대 줌 레벨로 polygon데이터를 보여 줍니다

					function saveCaption(){
					 polygon.removeCaption();
					 polygon.setCaption({title:$("#captionText").val(), color:"black"});
					 $(".popupWrapper").remove();

					}
실행결과

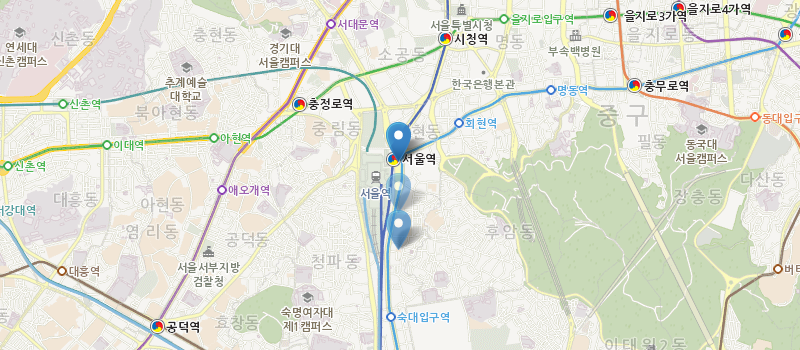
- 여러 개 마커 제어하기
-
지도 위에 마커를 제어하는 예제입니다.
생성된 맵에 이벤트를 걸어 마우스 오른쪽 버튼을 클릭한 좌표에 마커를 생성할 수 있습니다.
예제소스
</> 소스 예제 실행
					var map = sop.map('map');
					map.setView(sop.utmk(953427, 1950827), 5);

					//맵에 왼쪽 마우스 버튼 클릭시 마커 생성
					map.on("contextmenu",function(e) {
					 setTimeout(function() {
					  var x_coor = e.utmk.x;
					  var y_coor = e.utmk.y;
					  var marker = sop.marker([ x_coor, y_coor]);
					 marker.addTo(map);
					 }, 200);
					});
실행결과