var legendColor = ["#ccc", "#c2b5b9", "#b99ea6", "#b08893", "#a77180", "#9e5a6d", "#95445a", "#8c2d47", "#831634", "#7a0021"];
var legendCircleRadius = [10, 15, 20, 25, 30, 35, 40, 45, 50, 55];
var circleMarkerList = null;
var heat = null;
var map, mapOptions, oriArea, sopArea, logger, divConsole;
logger = divLogger();
mapOptions = {
ollehTileLayer: true,
measureControl: false,
zoomSliderControl: false,
panControl: false,
attributionControl: false
};
map = sop.map("map", mapOptions);
map.setView([953427, 1950827], 0);
function tokenKeySetting(){
accessToken = $("#tokenKey").val();
}
function createServiceRequest(reqFunc, reqParam) {
return function () {
// 인증 API
$.ajax({
url : 'https://sgisapi.kostat.go.kr/OpenAPI3/auth/authentication.json' +
'?consumer_key='+consumer_key+'&consumer_secret='+consumer_secret,
type : 'get',
success: function (res, status) {
reqParam.accessToken = res.result.accessToken;
reqFunc(reqParam);
}
});
}
}
sop.DomUtil.get("clear").onclick = clear;
divConsole = sop.DomUtil.get("divCon");
function addArea(type) {
if($("#tokenKey").val() == ""){
alert("키를 입력해주세요");
return;
}
clear();
var year = "2010";
var adm_cd = "11";
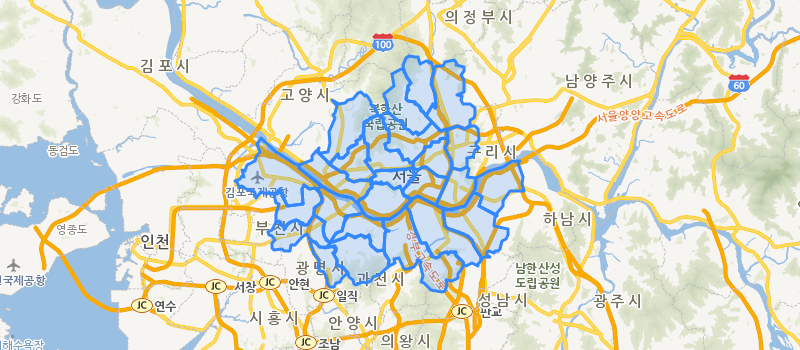
$.ajax({
url : 'https://sgisapi.kostat.go.kr/OpenAPI3/boundary/hadmarea.geojson' +
'?accessToken='+ accessToken +'&year='+year+'&adm_cd='+adm_cd,
type : 'get',
datatype : "geojson",
success: function( res,status) {
oriArea = res;
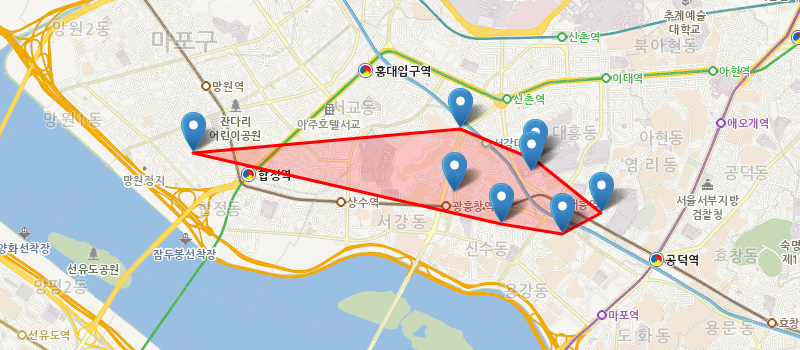
if(type=="color"){
sopArea = sop.geoJson(res).addTo(map);
map.fitBounds(sopArea.getBounds());
}else if(type=="bubble" || type=="dot" || type=="heat"){
circleMarkerList = makeCircleList(res);
}
logger("경계조회 결과");
logger("" + JSON.stringify(res, null, 2) + "
");
},
complete : function(){
addStatistic(type);
},
});
}
function addStatistic(type) {
if (!oriArea) {
alert("경계조회를 먼저 하세요");
return;
}
var year = "2010";
var adm_cd = "11";
var low_search = "1";
$.ajax({
url : 'https://sgisapi.kostat.go.kr/OpenAPI3/stats/population.json' +
'?accessToken='+accessToken+'&year='+year+'&adm_cd='+adm_cd+
'&low_search=' +low_search,
type : 'get',
success: function (res,status) {
// 맵형태로 변환 한다.
var idx, len, target, conComplite = {}, key, value, strToolTip;
target = res.result;
for (idx = 0, len = target.length; idx < len; idx ++) {
conComplite[target[idx].adm_cd] = target[idx];
}
var objectList = new Array();
logger("----------- [ 가구통계 조회 성공 ] -----------");
logger("" + JSON.stringify(res, null, 2) + "
");
if(type=="color"){
sopArea.eachLayer(function (layer) {
key = layer.feature.properties.adm_cd;
value = conComplite[key];
if (!value) { return; }
strToolTip = "지역(구)명 : " + value.adm_nm + "
";
strToolTip += "총인구 : " + value.tot_ppltn + "
";
strToolTip += "ADM : " + key + "
";
layer.bindToolTip(strToolTip);
var object = new Object();
object.value = value.tot_ppltn;
object.admCd = key;
objectList.push(object);
});
}else if(type == "bubble" || type == "dot" || type == "heat"){
for(var i = 0; i < circleMarkerList.length; i++){
var infos = circleMarkerList[i].options.infos;
key = infos.adm_cd;
value = conComplite[key];
if (!value) { return; }
strToolTip = "지역(구)명 : " + value.adm_nm + "
";
strToolTip += "총인구 : " + value.tot_ppltn + "
";
strToolTip += "ADM : " + key + "
";
circleMarkerList[i].options.tooltipMsg = strToolTip;
circleMarkerList[i].bindInfoWindow(circleMarkerList[i].options.tooltipMsg);
var object = new Object();
object.value = value.tot_ppltn;
object.admCd = key;
objectList.push(object);
}
}
var legend = calculateLegend(objectList);
if(type=="color"){
areaFillColor(objectList,legend);
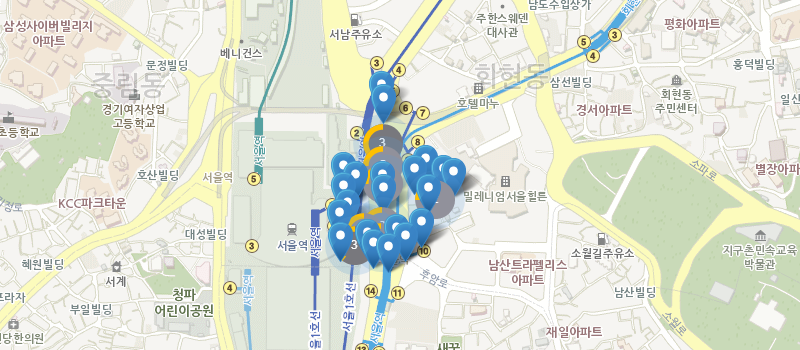
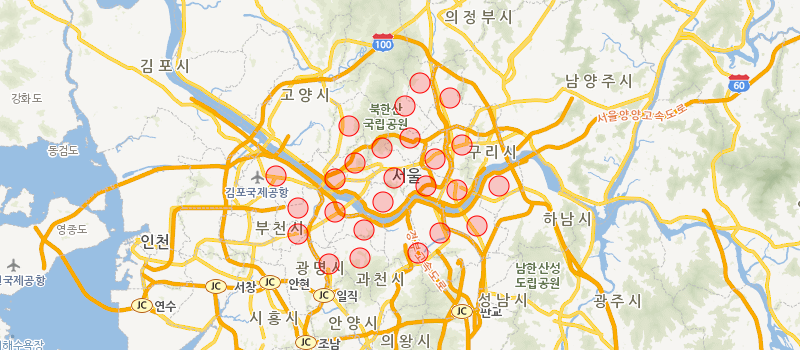
}else if(type == "bubble"){
circleMarkerList = areaSizeCircle(objectList,legend,circleMarkerList);
gridCirCle(circleMarkerList);
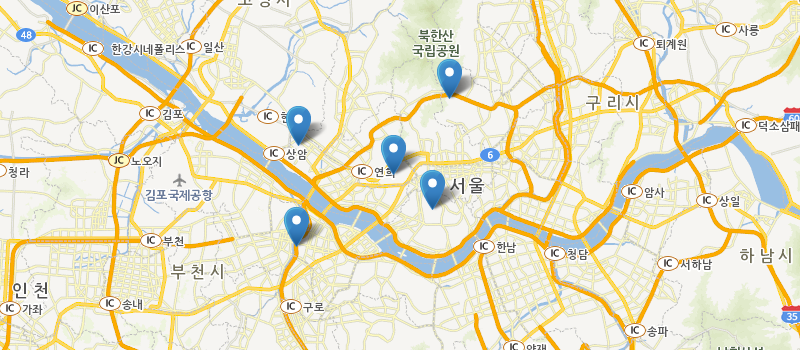
}else if(type == "dot"){
gridCirCle(circleMarkerList);
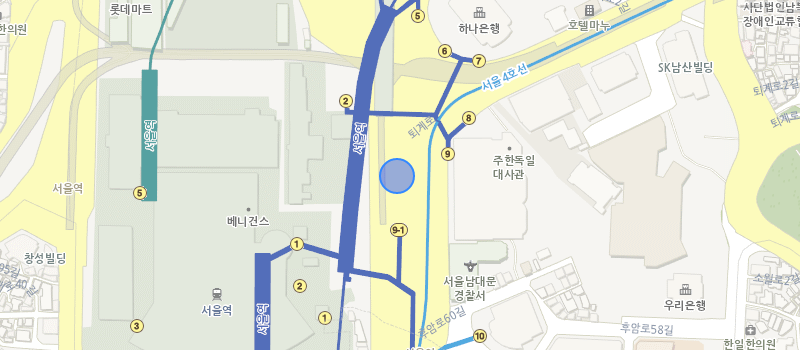
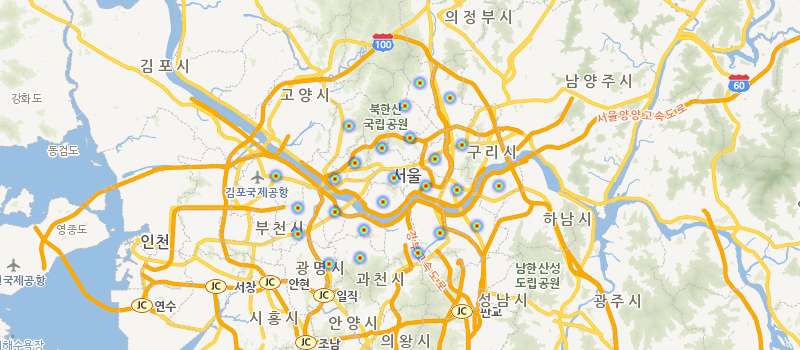
}else if(type == "heat"){
circleMarkerList = areaSizeCircle(objectList,legend,circleMarkerList);
addHeatMap(circleMarkerList);
}
}
});
}
function clear() {
if (sopArea) {
sopArea.remove();
}
if(heat !=null){
map.removeLayer(heat);
}
if(circleMarkerList !=null){
for(var i =0; i < circleMarkerList.length; i ++){
circleMarkerList[i].remove();
}
}
sopArea = undefined;
oriArea = undefined;
divConsole.innerHTML = "";
logger("------------- 지도초기화 완료 -------------");
}
function divLogger() {
var lineNum = 0;
var prefix = "";
return function (str) {
prefix = lineNum++ + " : ";
str = prefix + str;
if (divConsole.innerHTML.length < 300000) {
divConsole.innerHTML += str;
} else {
divConsole.innerHTML = str;
}
divConsole.innerHTML += "
";
divConsole.scrollTop = divConsole.scrollHeight;
};
}
function areaFillColor(objectList,legend){
sopArea.eachLayer(function (layer) {
var admCd = layer.feature.properties.adm_cd;
for(var i =0; i < objectList.length; i++){
if(objectList[i].admCd == admCd){
if(legend[legend.length-1] <= objectList[i].value){
layer.setStyle({
weight : 3,
color : legendColor[legend.length-1],
fillColor :legendColor[legend.length-1]
});
}else{
for(var j=0; j < legend.length; j ++){
if(legend[j] >= objectList[i].value){
layer.setStyle({
weight : 3,
color : legendColor[j],
fillColor :legendColor[j]
});
break;
}
}
}
}
}
});
}
function areaSizeCircle(objectList,legend,circleMarkerList){
//options.radius
for(var i = 0; i < circleMarkerList.length; i++){
if(legend[legend.length-1] <= objectList[i].value){
circleMarkerList[i].setStyle({
color : legendColor[legend.length-1],
fillColor : legendColor[legend.length-1],
radius : legendCircleRadius[legend.length-1]
});
}else{
for(var j = 0; j < legend.length; j++){
if(legend[j] >= objectList[i].value){
circleMarkerList[i].setStyle({
color : legendColor[j],
fillColor : legendColor[j],
radius : legendCircleRadius[j]
});
break;
}
}
}
}
return circleMarkerList;
}
function gridCirCle(circleList){
for(var i =0; i < circleList.length; i++){
circleList[i].addTo(map);
}
}
function makeCircleList(geoData){
var features = geoData.features;
var markerList = new Array();
for(var i =0; i < features.length; i ++){
var marker = sop.circleMarker([features[i].properties.x, features[i].properties.y], {
radius : legendCircleRadius[0],
fillColor : "red",
color : "red",
weight : 1,
tooltipMsg : "",
infos : {
idx : i,
adm_cd : features[i].properties.adm_cd,
adm_nm : features[i].properties.adm_nm,
data : "",
}
});
markerList.push(marker);
}
return markerList;
}
function addHeatMap(circleList){
heat = sop.heatLayer();
heat.addTo(map);
heat.setOptions({
minOpacity : 0.01,
radius : 5,
blur : 5,
max : 1
});
var xyList = new Array();
for(var i =0; i < circleList.length;i++){
xyList[i] = [circleList[i]._utmk.x,circleList[i]._utmk.y];
console.log(circleList[i]._radius);
heat.addUTMK([circleList[i]._utmk.x,circleList[i]._utmk.y,(circleList[i]._radius * 100000)]);
}
}
function calculateLegend(list){
if(list == null || list.length == 0){
return;
}
var arData = new Array();
arData[0] = new Array();
for(var i = 0; i < list.length; i++){
arData[0].push(list[i].value);
}
var legendValue = new Object();
legendValue.equal = [];
legendValue.auto = [];
var tmpData = [];
for (var i=0; i < arData.length; i++) {
var tmpData = arData[i];
for (var x=0; x < tmpData.length; x++) {
tmpData[x] = parseFloat(parseFloat(tmpData[x]).toFixed(2));
}
}
return calEqualLegend(arData);
}
function calEqualLegend(arData){
var equalMin, equalMax;
var tmpValPerSlice = [];
for ( var k = 0; k < arData.length; k++) {
if (arData[k].length == 1) {
var data = arData[k][0];
var tmpResult = new Array();
for ( var x = 0; x < 10; x++) {
var value = data+(data*x);
tmpResult.push(parseFloat(parseFloat(value).toFixed(2)));
}
tmpValPerSlice[k] = tmpResult;
}else {
var min = Math.min.apply(null, arData[k]);
var max = Math.max.apply(null, arData[k]);
equalMin = min;
equalMax = max;
var result = (max - min) / (10);
if (result == 0 && min != max) {
result = 1;
}
var tmpResult = new Array();
for ( var y=0; y <10; y++) {
if (result == 1 && min != max) {
tmpResult.push(result);
}else {
tmpResult.push(parseFloat(parseFloat((min+result * y)).toFixed(2))); //그래서 303 + 57*
}
}
tmpValPerSlice[k] = tmpResult;
}
}
return tmpValPerSlice[0];
}