
Youth Statistics Map
Service Overview
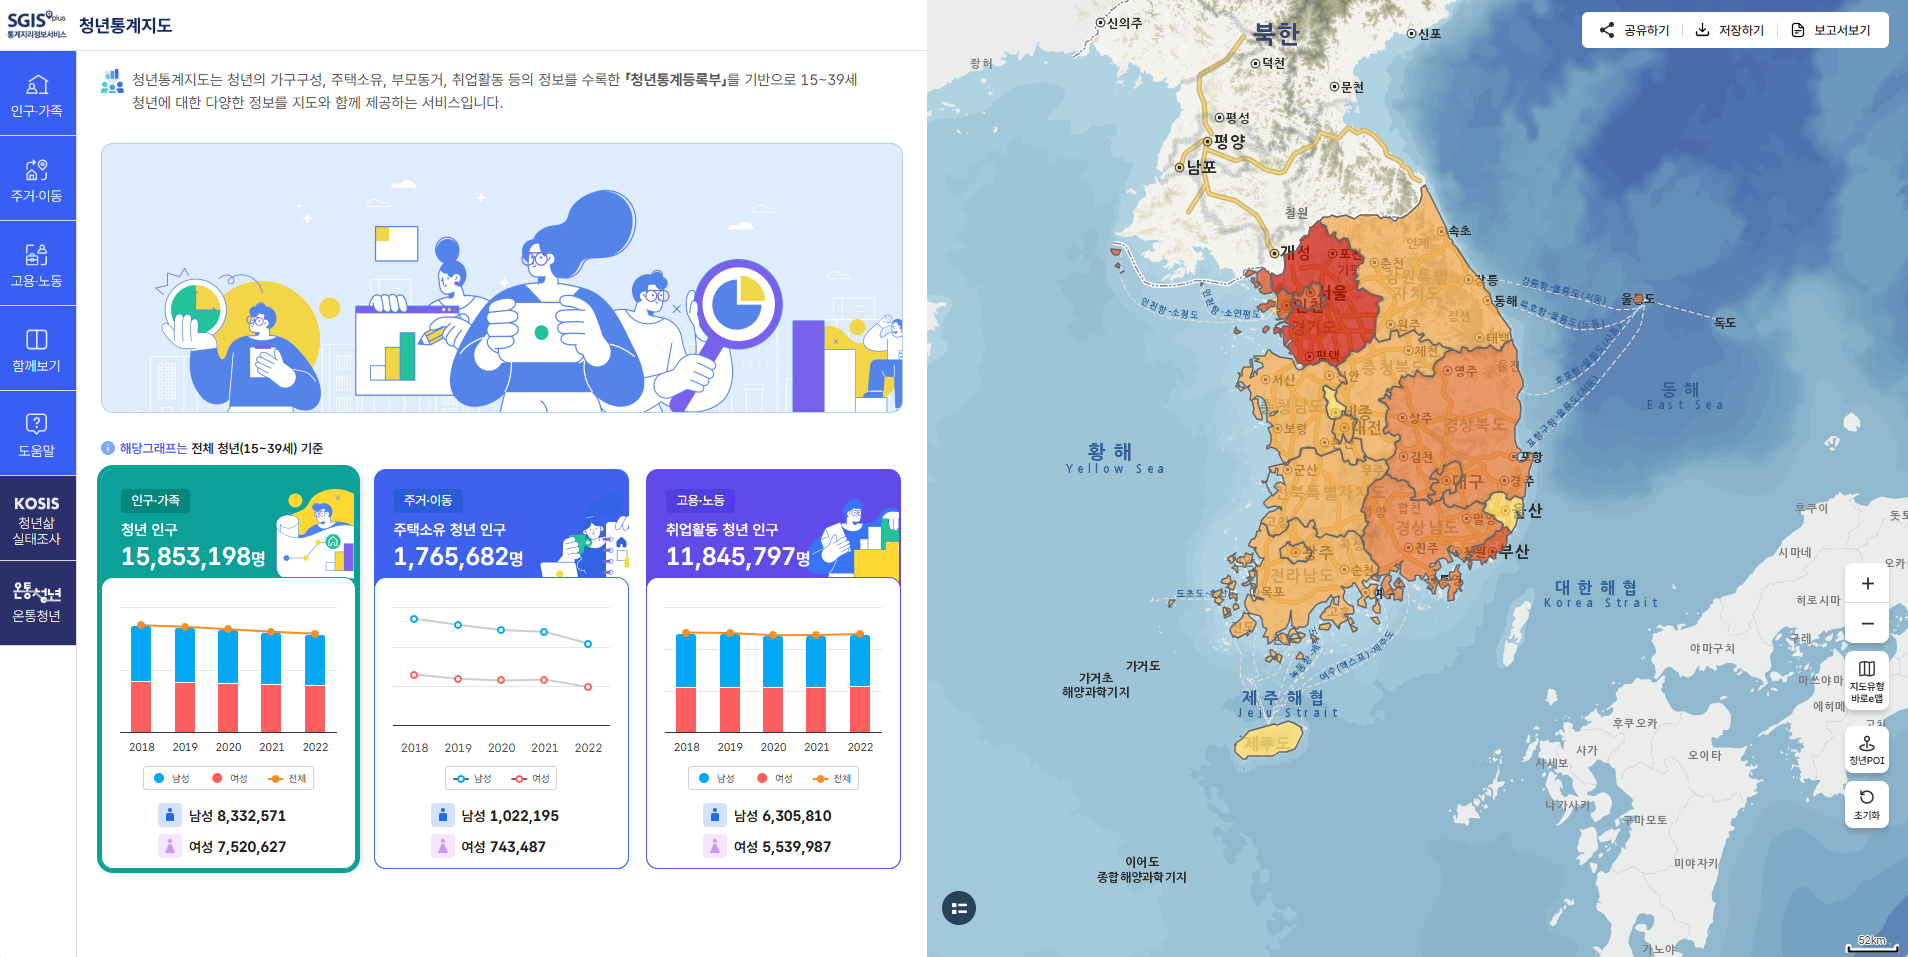
○ Based on the Youth Statistics Register, which includes data on household composition, house ownership, whether to live with parents, employment activities, etc., ‘Youth Statistics Map’ provides various information about the youth population aged 15~39, through maps.
○ A total of 48 indicators are provided in the following 3 sectors: Population and Family, Housing and Transportation and Employment and Labor.
○ Major features
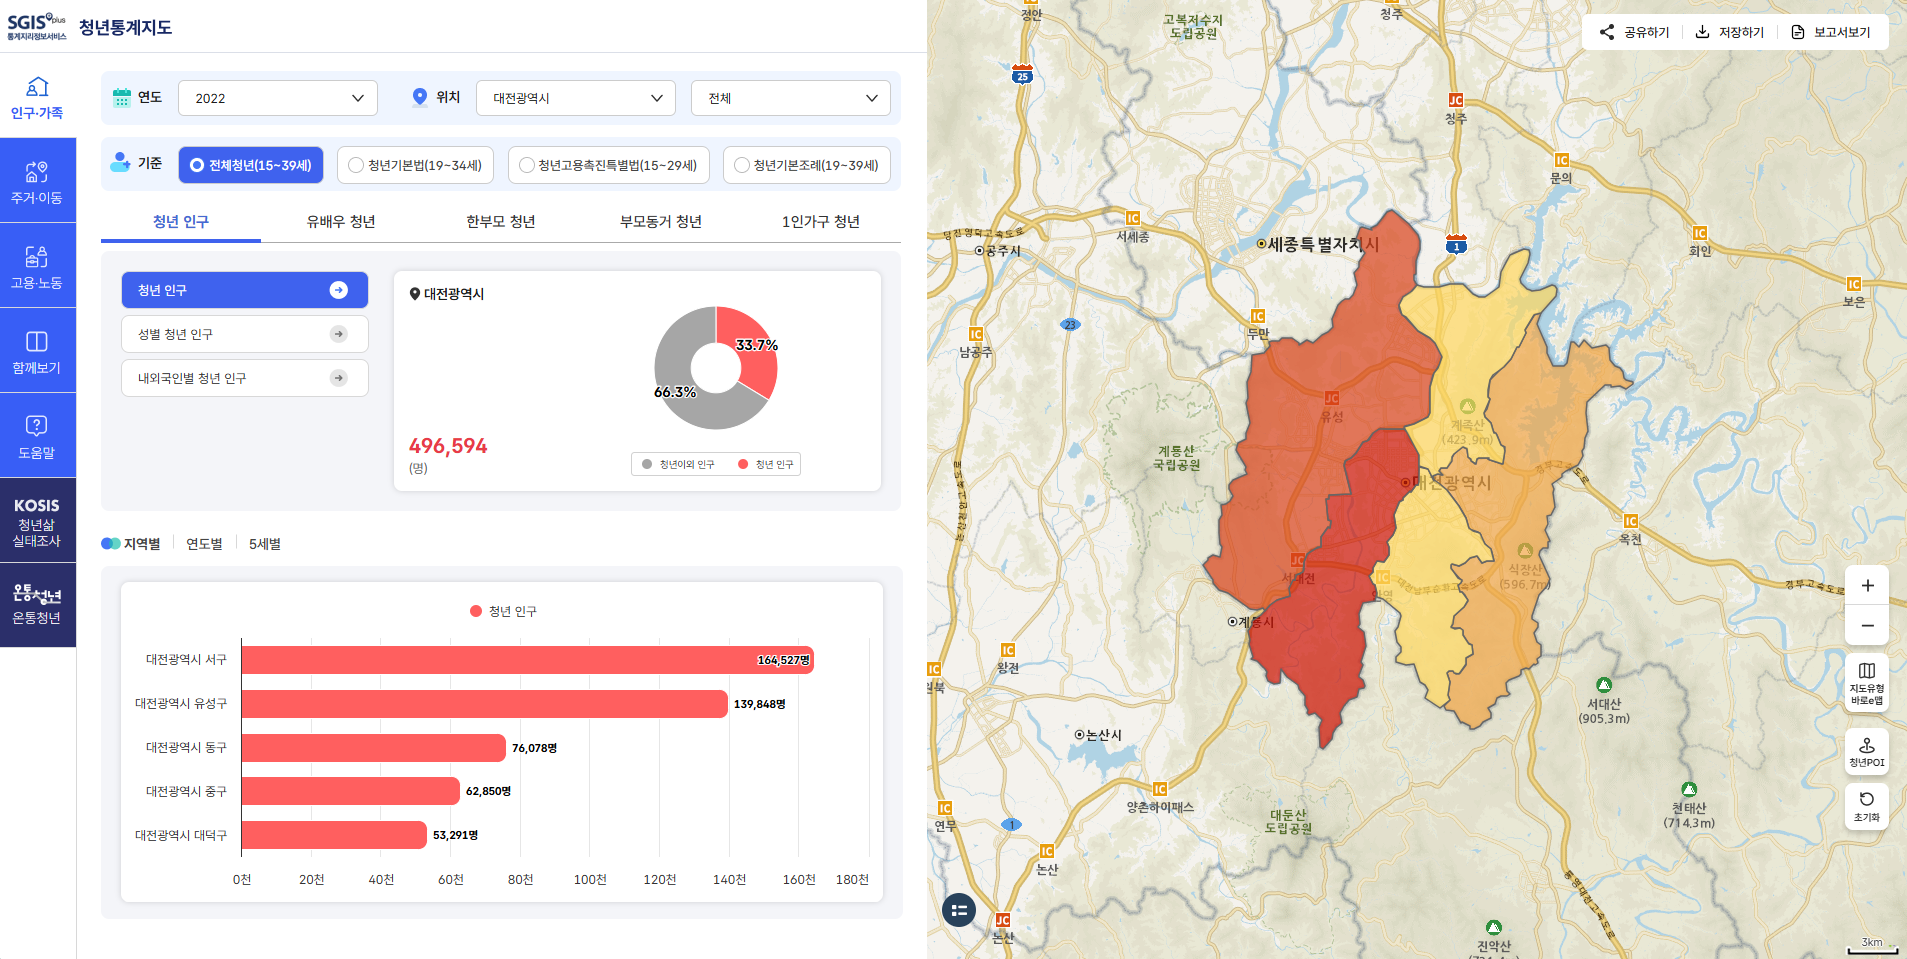
- Users can retrieve data on the youth population by age group.
- Users can retrieve data on the youth population by region, year and 5-year age group, which enables exploration from diverse perspectives.
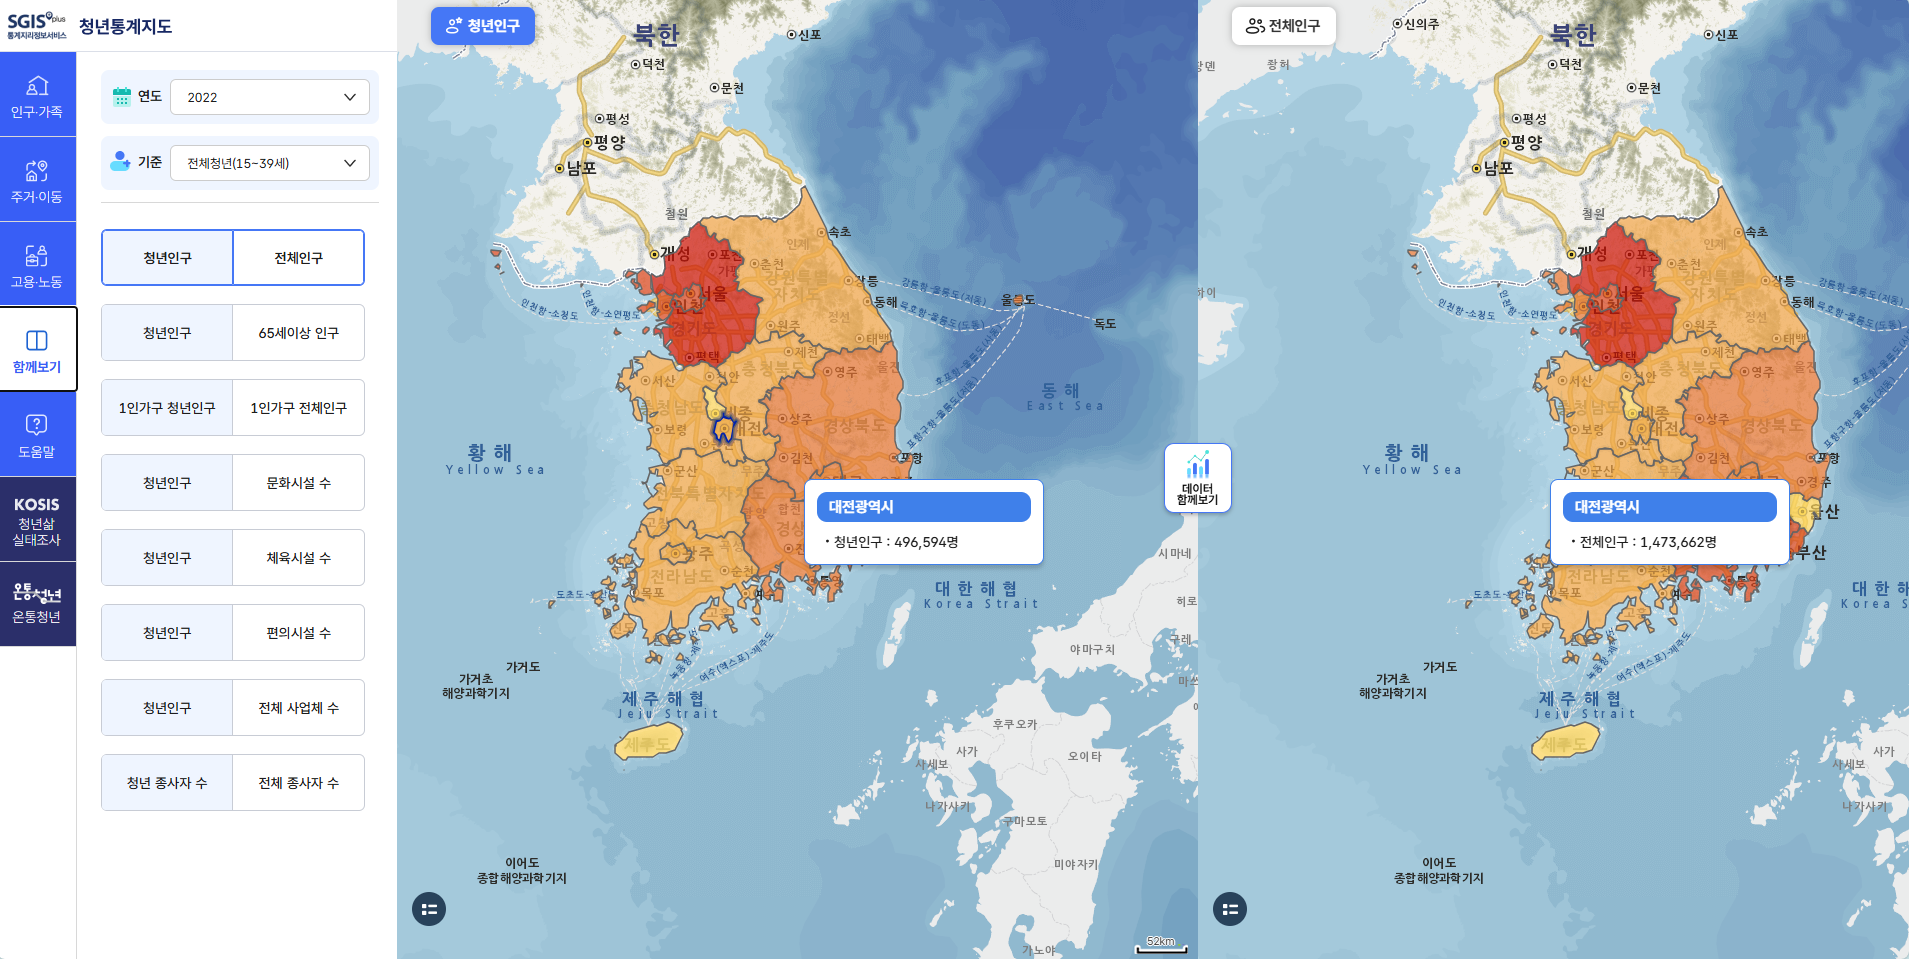
- Users can compare data based on the Youth Statistics Register with indicators from the Register-based Population and Housing Census and the Census on Establishments.
- Through Youth Points of Interest (POIs), users can access valuable data such as the locations of the ‘Youth Centers’ and ‘Youth-friendly enterprises’, and further details.
- For user convenience, this service provides the following features: data sharing, data saving, and viewing data in a report format.
Screen Layout
Statistical Map of Natural Disasters
Service Overview
○ 'Statistical Map of Natural Disasters' is a service that provides statistical information such as the population and establishments of the areas affected by natural disasters, after combining the areas affected by natural disasters including typhoons, floods, and landslides with spatial statistical information.

○ Major features
- Typhoon
∙ Display the areas within the radius of the storm under the practically significant impact of the typhoon and provide statistical information on the areas
∙ Radius of the storm: Radius of wind speed of 25 m/s or more from the center of the typhoon
∙ When the strong wind radius and tropical depression are provided without the storm radius, only the typhoon path is displayed. The menu for statistical analysis is not provided.
- Flood
∙ Flood hazard map: A map showing the extent and depth of flooding in surrounding areas, under the assumption of extreme situations such as flooding exceeding the design frequency of river embankments and the excess of the capacity of rainwater drainage facilities (rainwater pumping stations), which the flood control center (Ministry of Environment) determines
- Landslide
∙ Landslide hazard map: A map representing areas with a high risk of landslides as grades, when landslide-causing factors such as heavy rain happen [Korea Forest Service]
∙ Please note that a high landslide grade [Grade 1-2] of an area doesn't imply that the area is currently dangerous. And a low landslide grade of an area doesn't imply that a landslide will take place in the area.
Screen layout
Homepage > Analysis map > Statistical Map of Natural Disasters
- Screen for typhoons
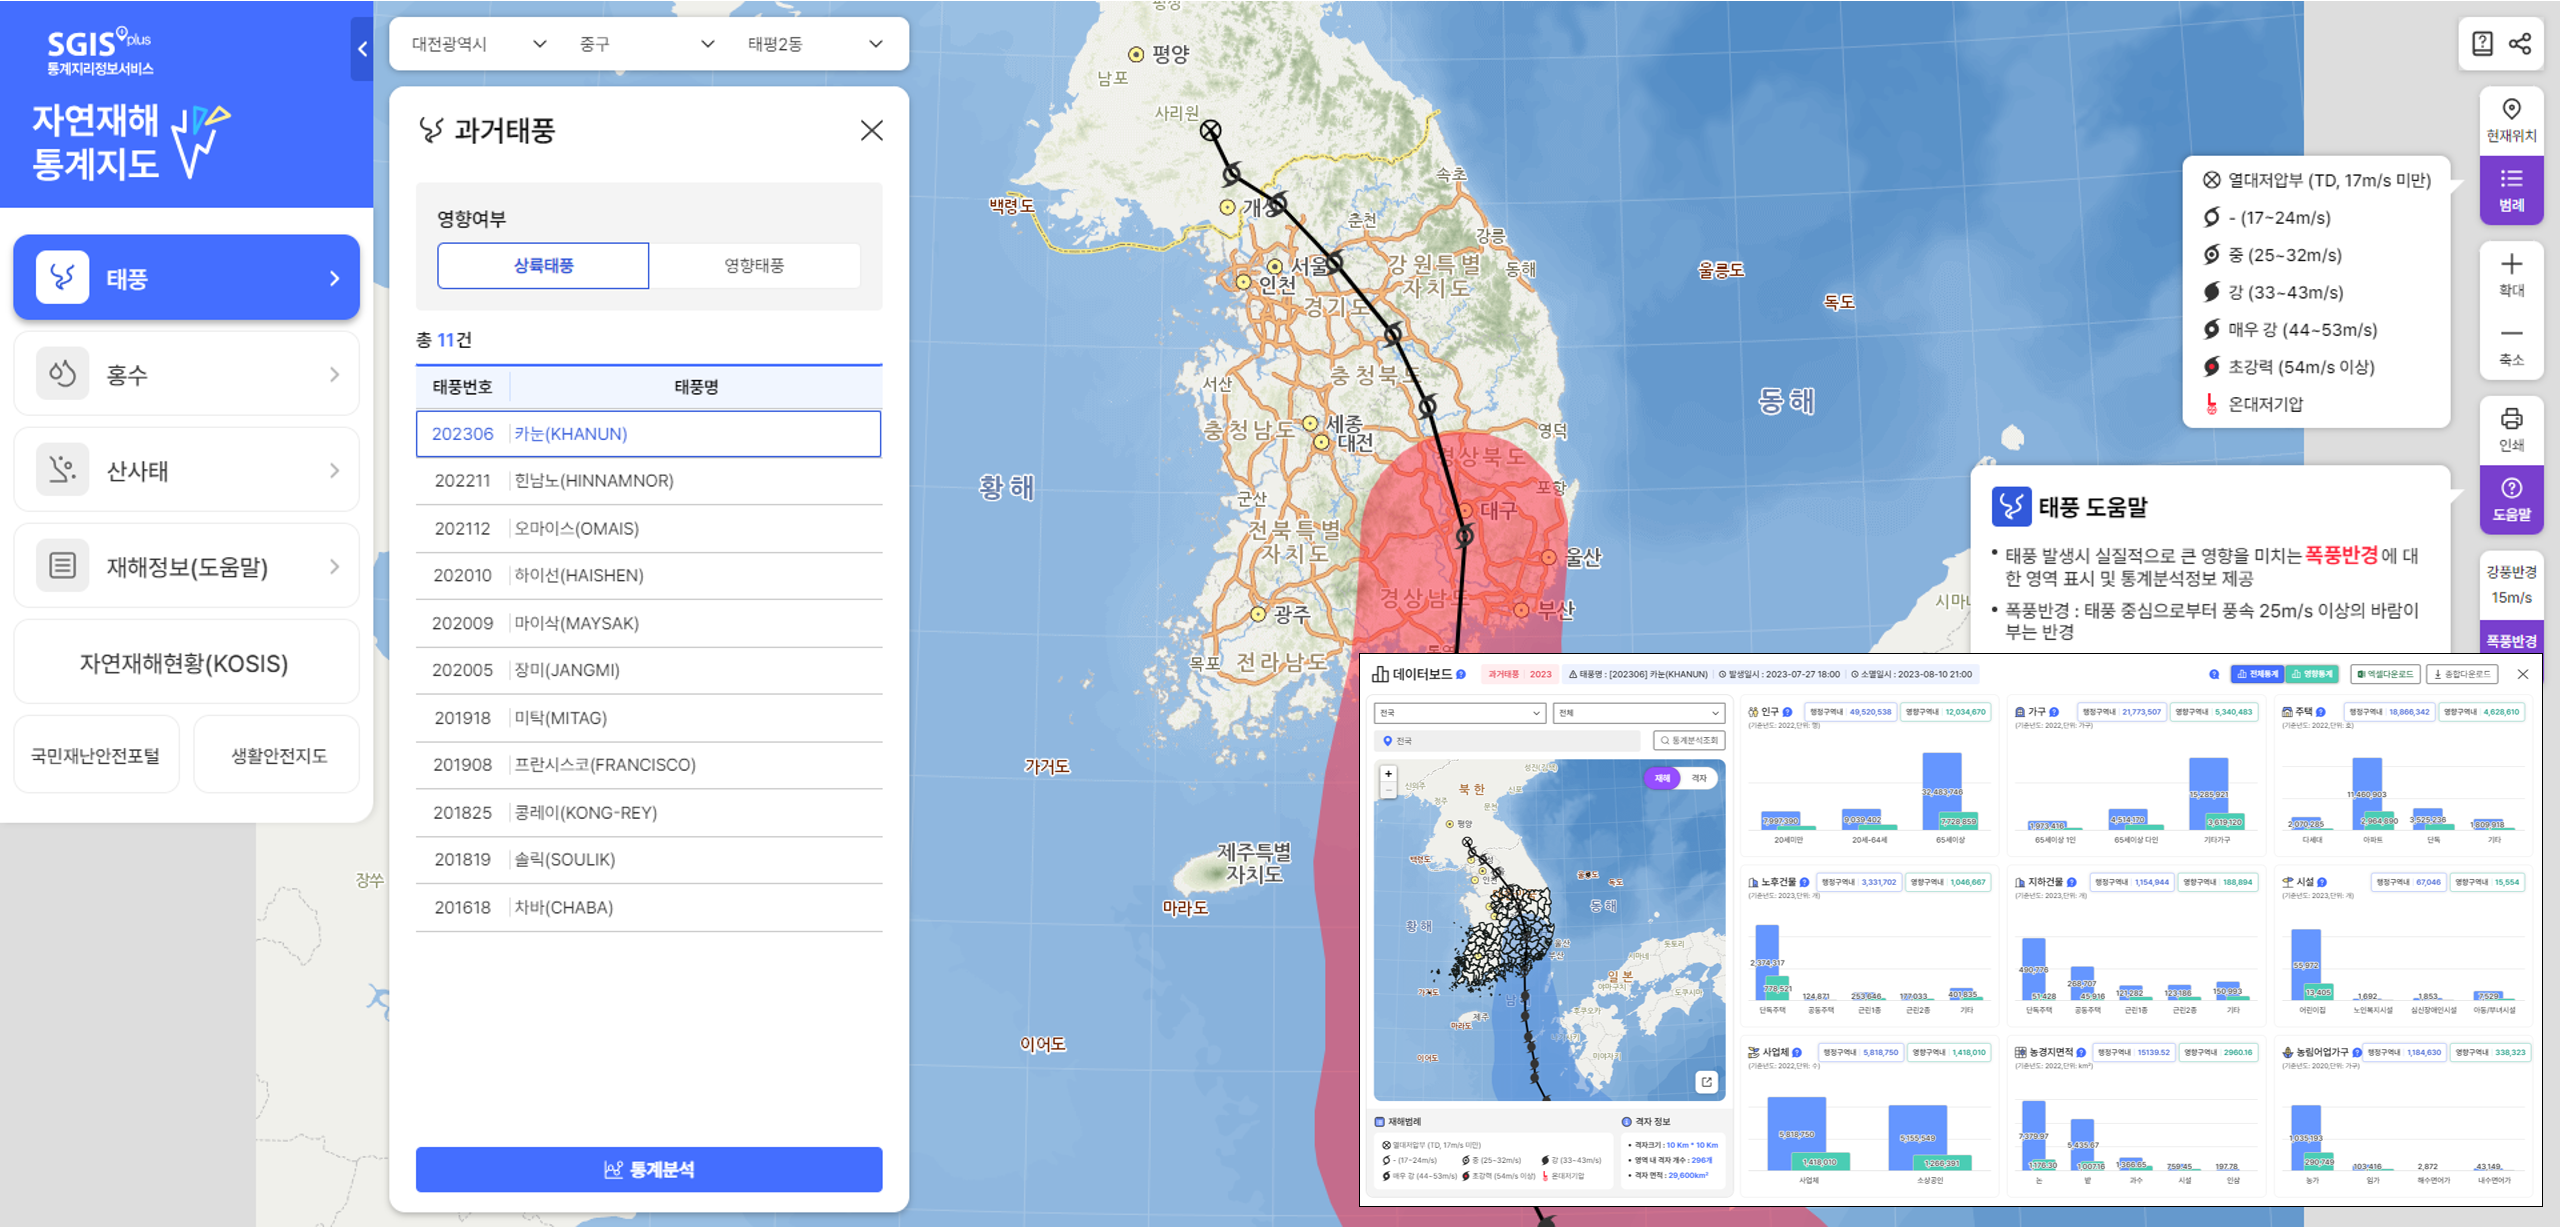
1) Menu selection: Typhoon
2) Typhoon search: After selecting typhoon influence, users can find detailed information of typhoons.
3) Radius of the storm: A map screen displaying the storm radius of the selected typhoon
4) Statistical analysis: Users can find statistical analysis data of the selected typhoon through 'Statistical analysis'.
5) Databoard: Based on typhoon disaster information, users can check disaster status through statistics on the population, households, houses, buildings, facilities, micro-enterprises, agricultural area, and farm, forestry, and fishery households, as well as disaster maps and grid maps.
- Screen for floods
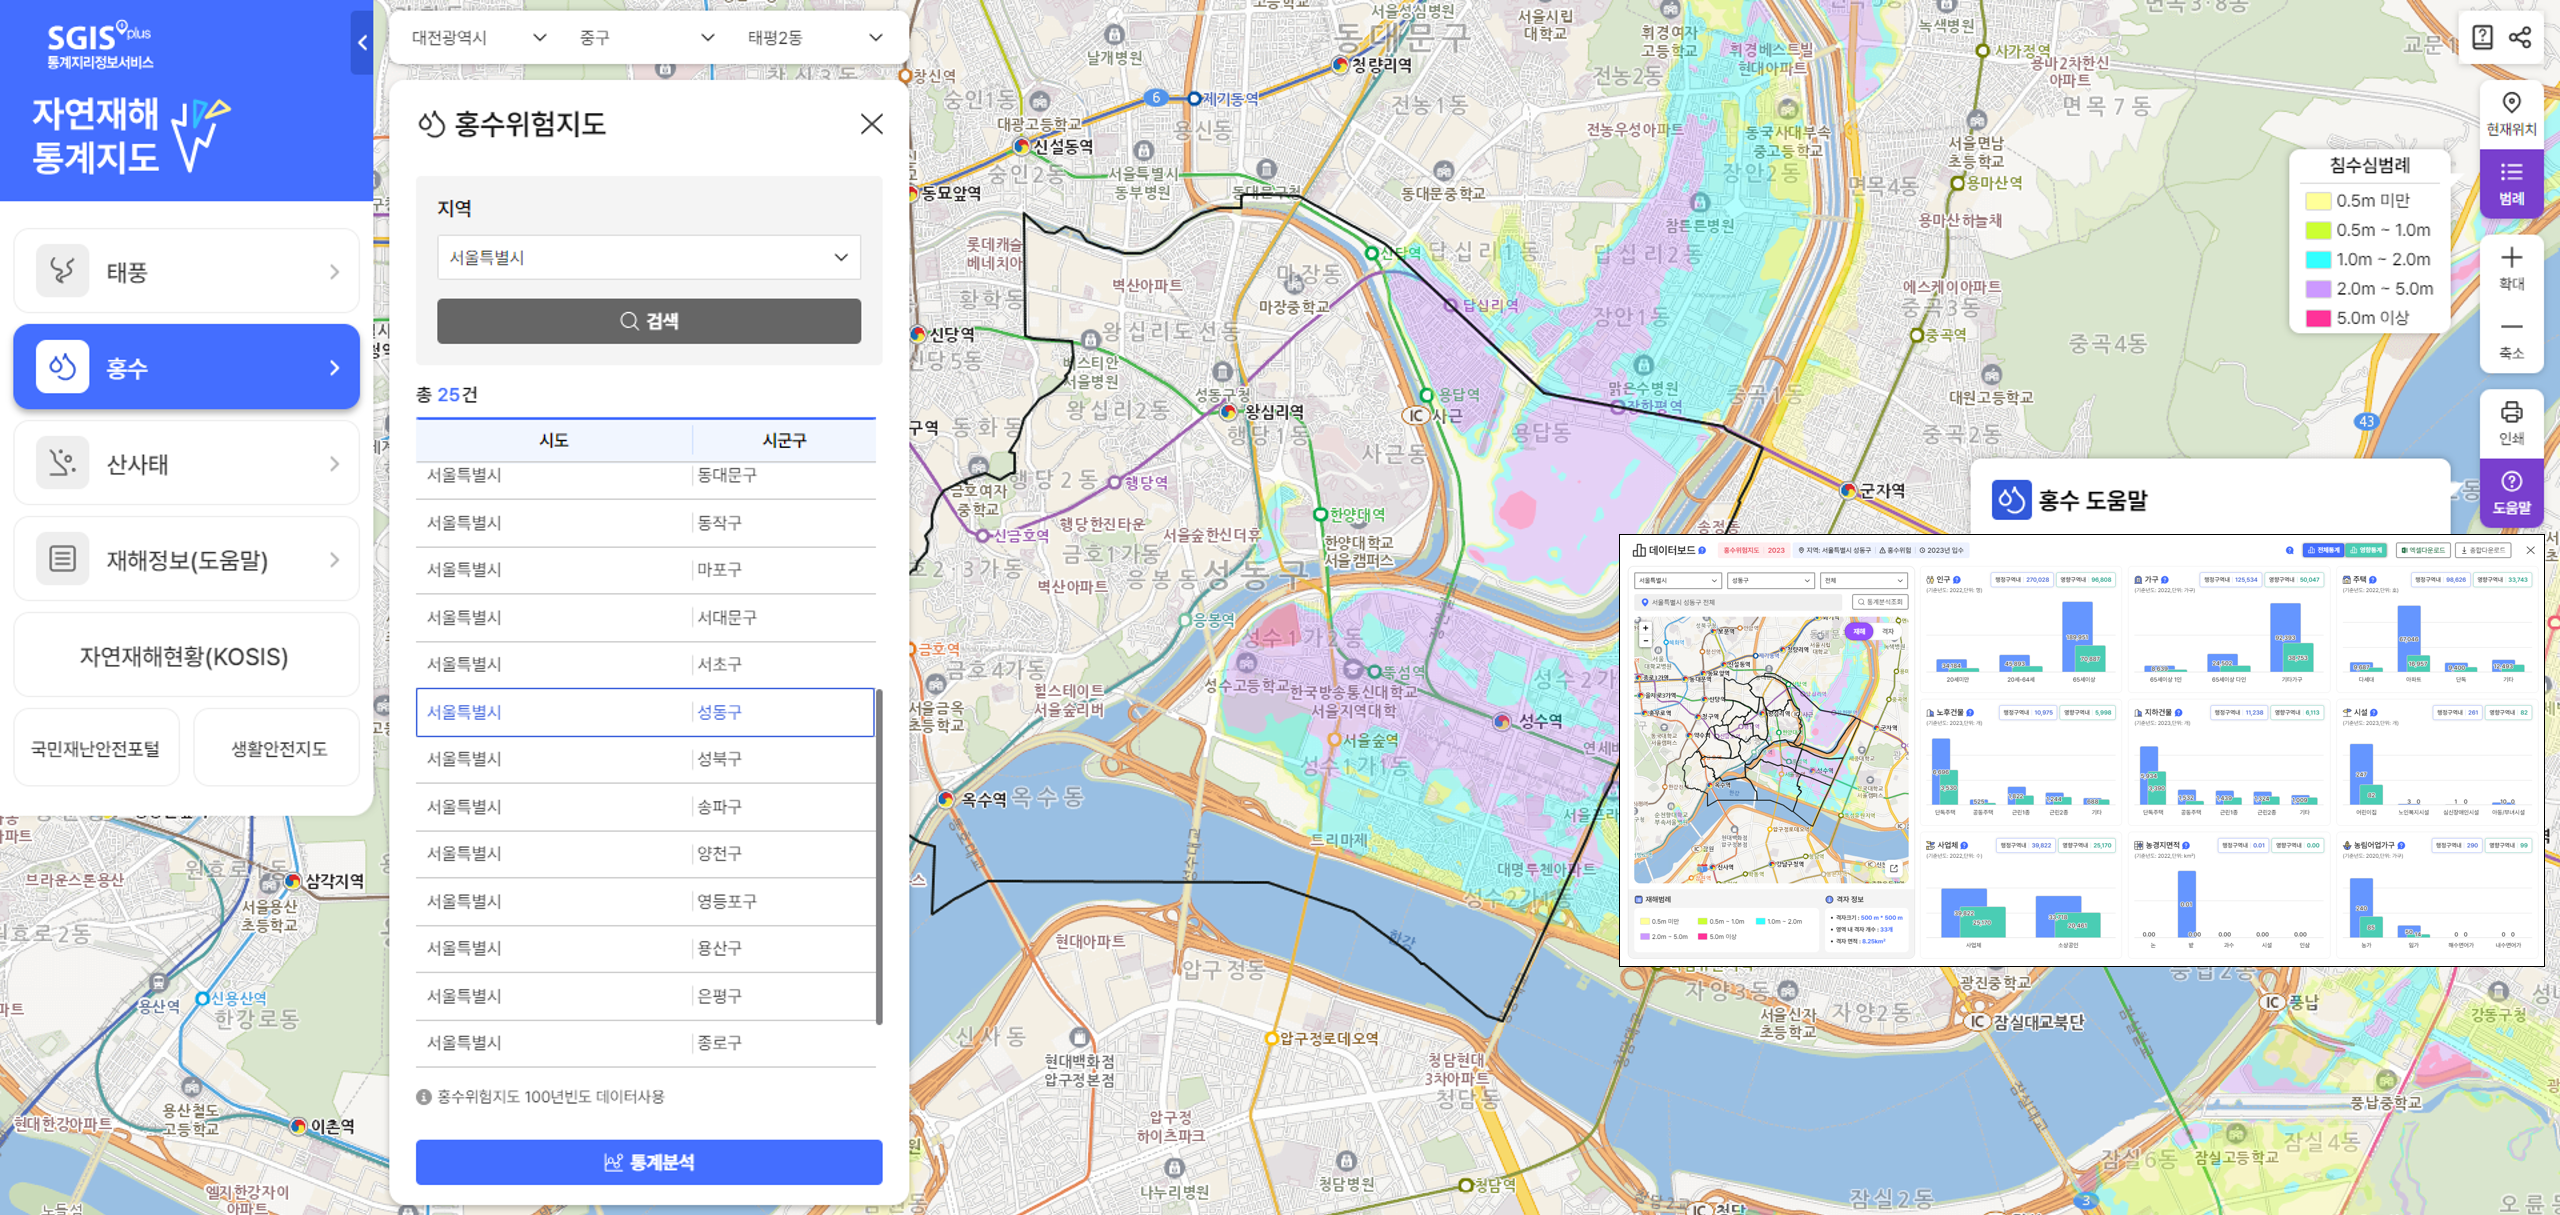
1) Menu selection: Flood
2) Flood information search: After selecting a desired area and clicking the "Search" button, users can find detailed information of floods.
3) Flood hazard map: A map screen displaying flood risks of the selected area
4) Statistical analysis: Users can find statistical analysis data of the flood of the selected area through 'Statistical analysis'.
5) Databoard: Based on flood disaster information, users can check disaster status through statistics on the population, households, houses, buildings, facilities, micro-enterprises, agricultural area, and farm, forestry, and fishery households, as well as disaster maps and grid maps.
- Screen for landslides
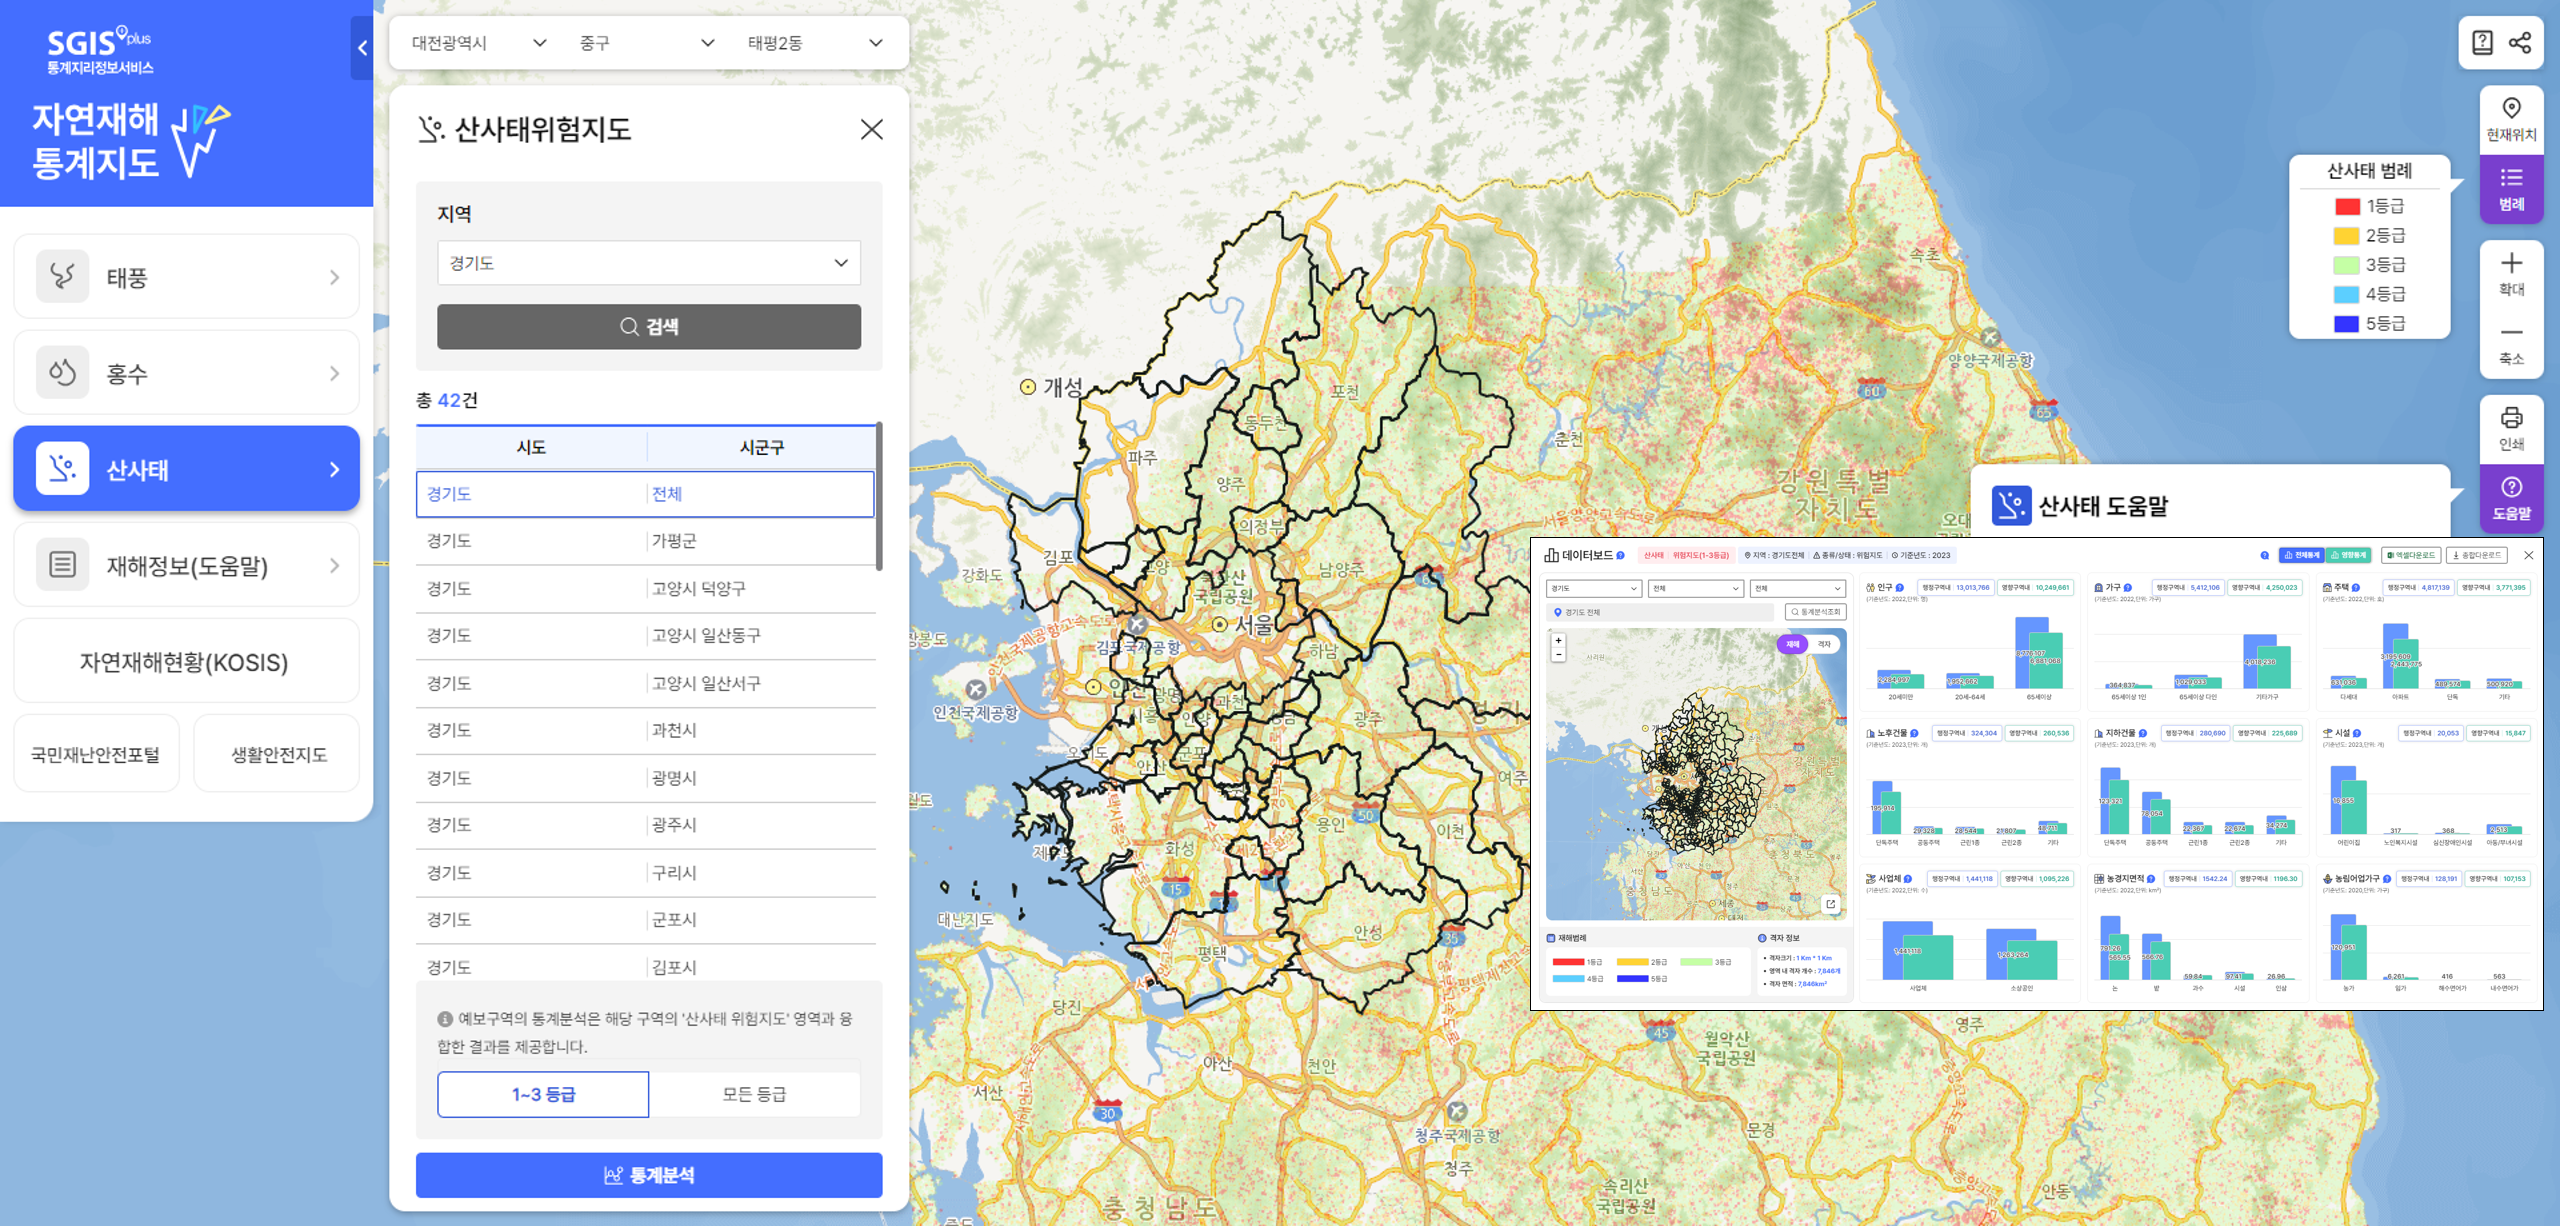
1) Menu selection: Landslide
2) Landslide information search: After selecting a desired area and clicking the "Search" button, users can find detailed information of landslides.
3) Landslide hazard map: A map screen displaying landslide risks of the selected area
4) Statistical analysis: Users can find statistical analysis data of the landslide of the selected area through 'Statistical analysis'.
5) Databoard: Based on landslide disaster information, users can check disaster status through statistics on the population, households, houses, buildings, facilities, micro-enterprises, agricultural area, and farm, forestry, and fishery households, as well as disaster maps and grid maps.
Urbanization Analysis Map
Service Overview
○ It provides changes in the urbanization areas according to demographic change, grid statistical data and analysis indicators by applying the Degree of Urbanization of the UN.
- UN's official adoption of the classification of cities: In 2020, the UN Statistical Committee officially endorsed the concept of cities that was developed by 6 international organizations including the European Union, United Nations Human Settlements Programme and the World Bank.
○ Regardless of administrative districts, a territory is classified into urban centres and urban clusters by considering population size per grid cell of km2.
* Grid: An area divided by horizontal and vertical lines that intersect at right angles regardless of administrative districts
- (Urban centre) An urban center consists of contiguous grid cells with a density of at least 1,500 inhabitants per km2 and has a population of at least 50,000 in the urban center.
- (Urban cluster) An urban cluster consists of contiguous grid cells with a density of at least 300 inhabitants per km2 and has a population of at least 5,000 in the cluster.
○ (Urbanization change) It provides dynamic time series data of urbanization areas (urban centre and urban cluster) from 2000.
○ (Urbanization statistics) It provides comparative data between grid statistical data (area, population, household, housing, establishment, worker) and administrative district (Si, Gun & Gu) data of urbanization areas (urban centre and urban cluster) from 2015.
○ (Urbanization indicator analysis) It provides time series data of urbanization-related indicators (population density, average age, aging index, share of one-person households, share of apartments), rankings of urbanization areas and comparative data between urban areas.
Screen layout
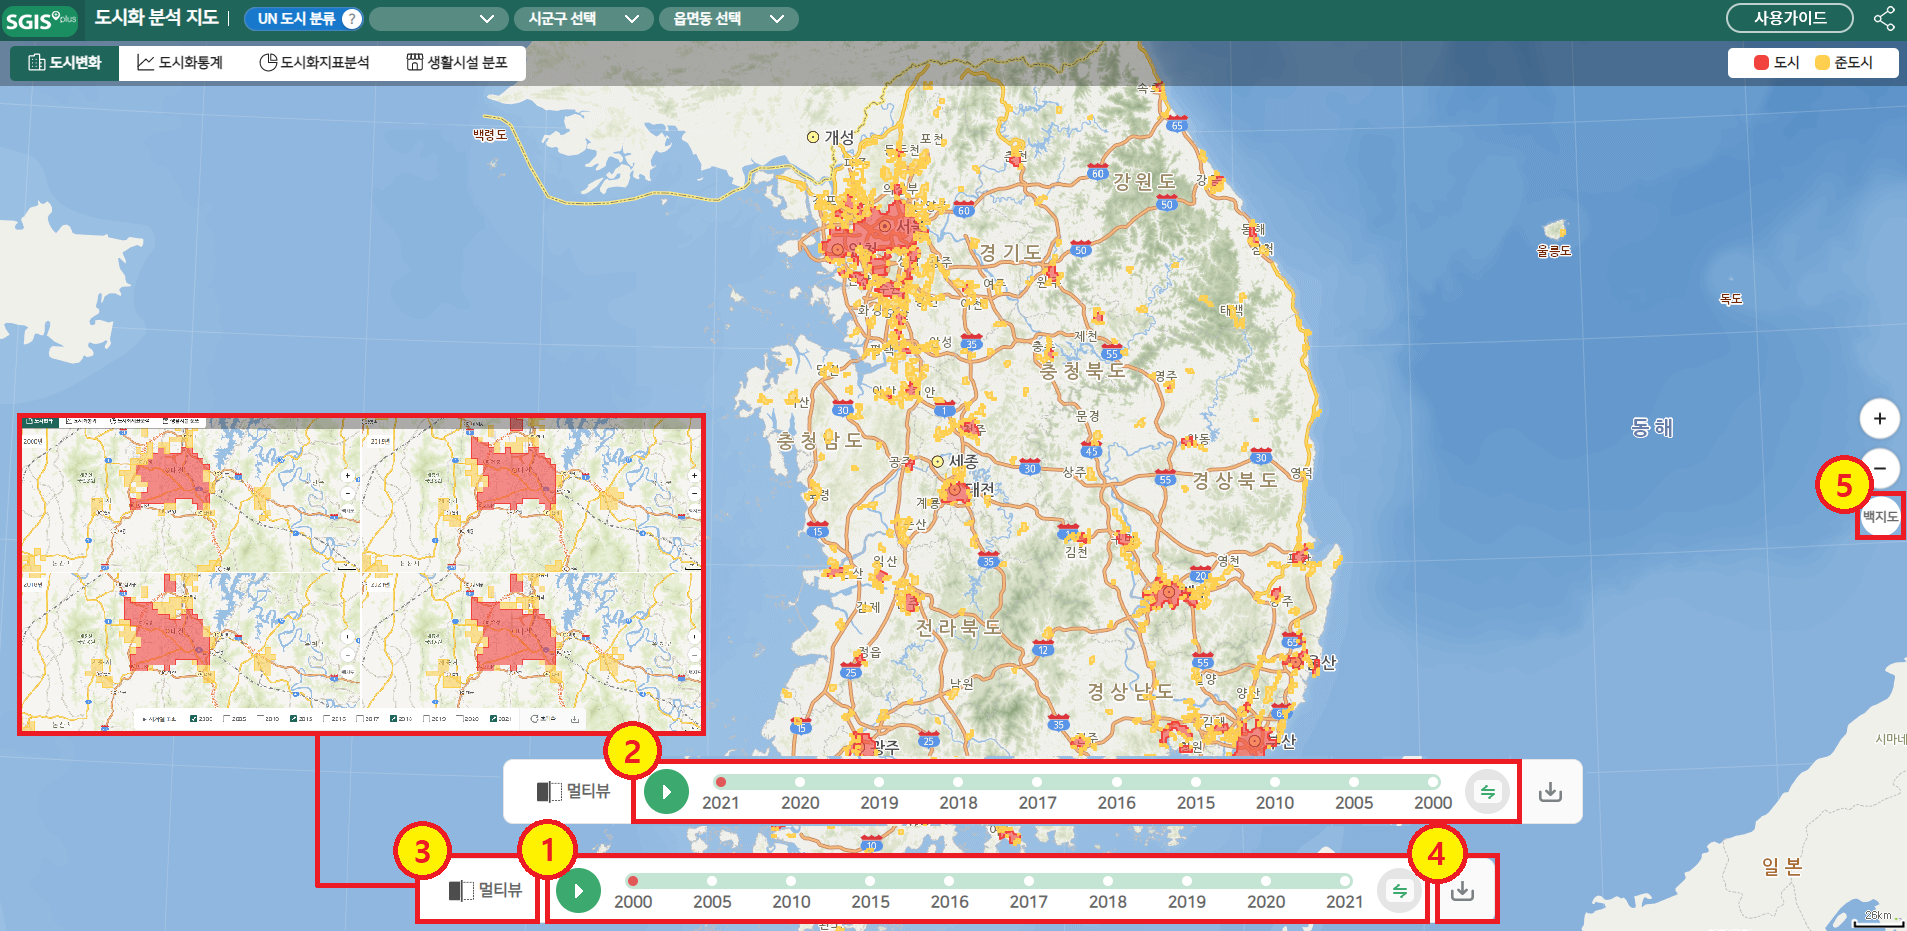
Homepage > Analysis map > Urbanization analysis map > Urbanization change
1) Users can check dynamic time series data of urbanization areas from 2000 to the recent time point by using the play and stop functions.
2) Users can check time series data of urbanization areas in reverse order from the recent time point by using the play and stop functions.
3) Users can download a map of an urbanization area for each year in the form of an image.
4) Users can set their preferred background map (general map, blank map).
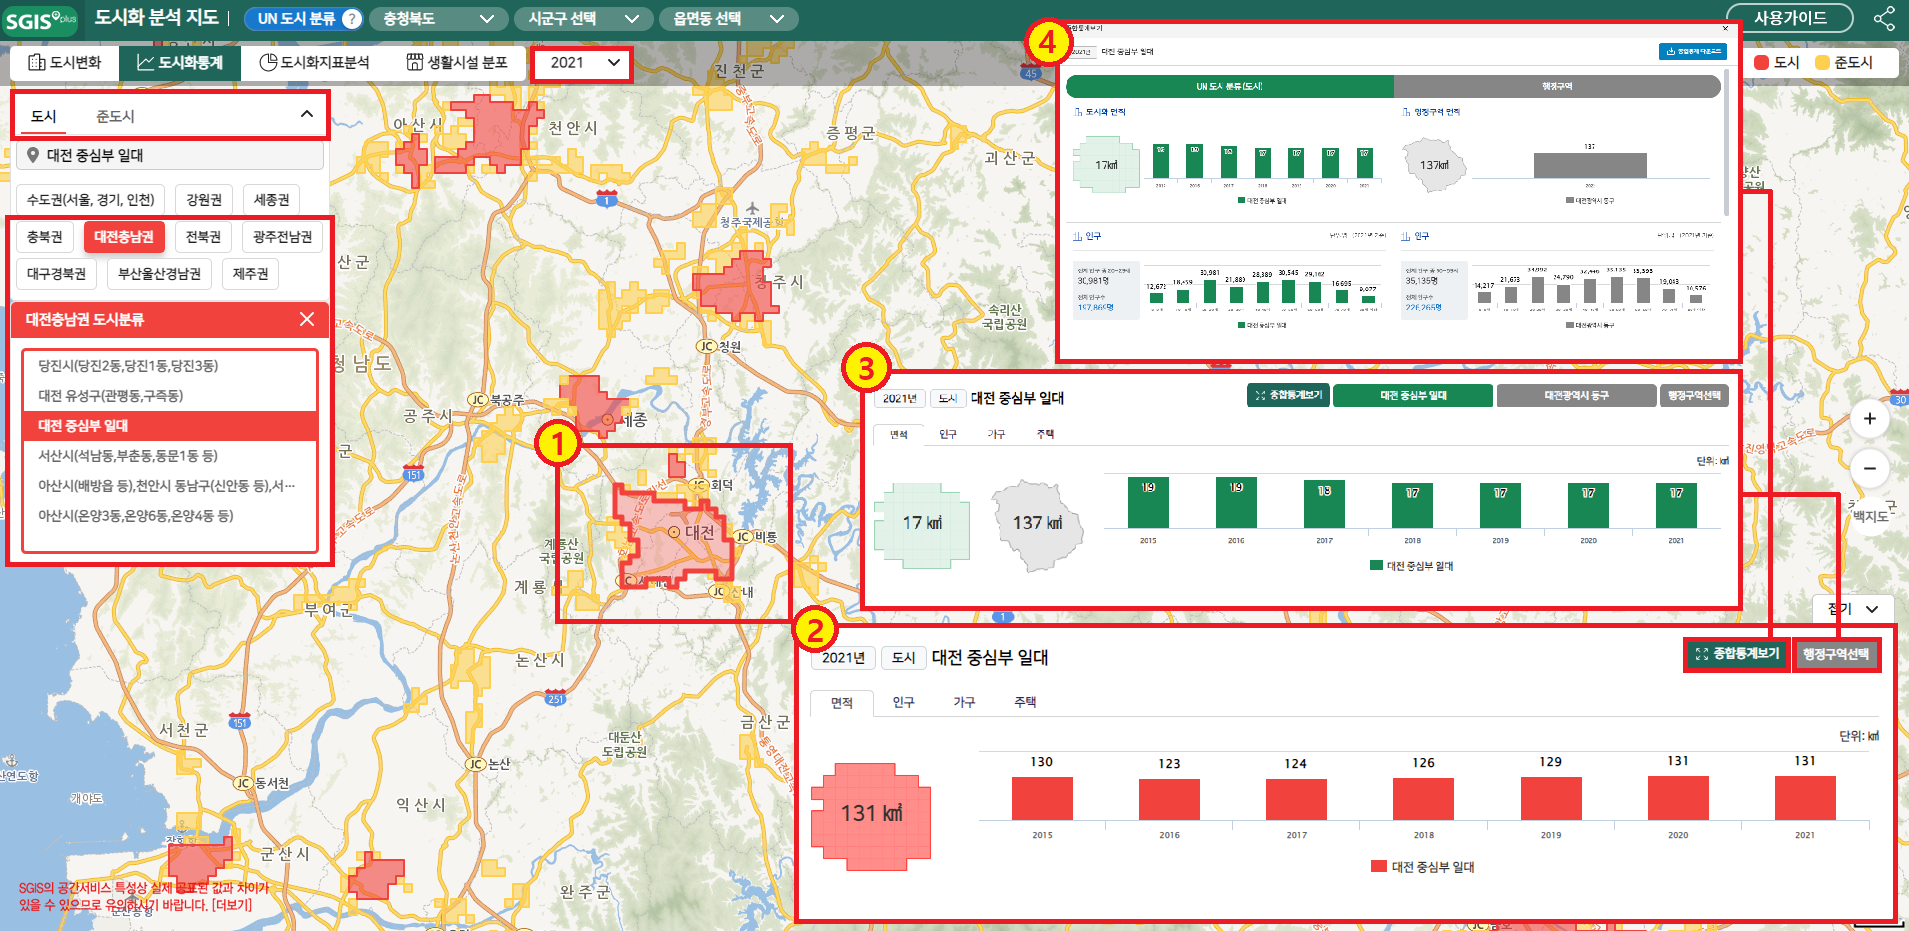
Homepage > Analysis map > Urbanization analysis map > Urbanization statistics
▶ Year selection → Urban centre / Urban cluster selection → Metropolitan area selection → Urbanization area selection → Grid statistical data retrieval
1) Users can check the distribution and boundaries of urban centres and urban clusters for a specific year.
2) Users can retrieve grid statistical data (area, population, household, housing, establishment, worker) of the selected urbanization area (urban centre / urban cluster).
3) Users can compare grid statistical data and administrative district (Si, Gun & Gu) data of the selected urbanization area (urban centre / urban cluster).
4) Through the comprehensive statistics viewing function, you can check the statistical data at a glance.
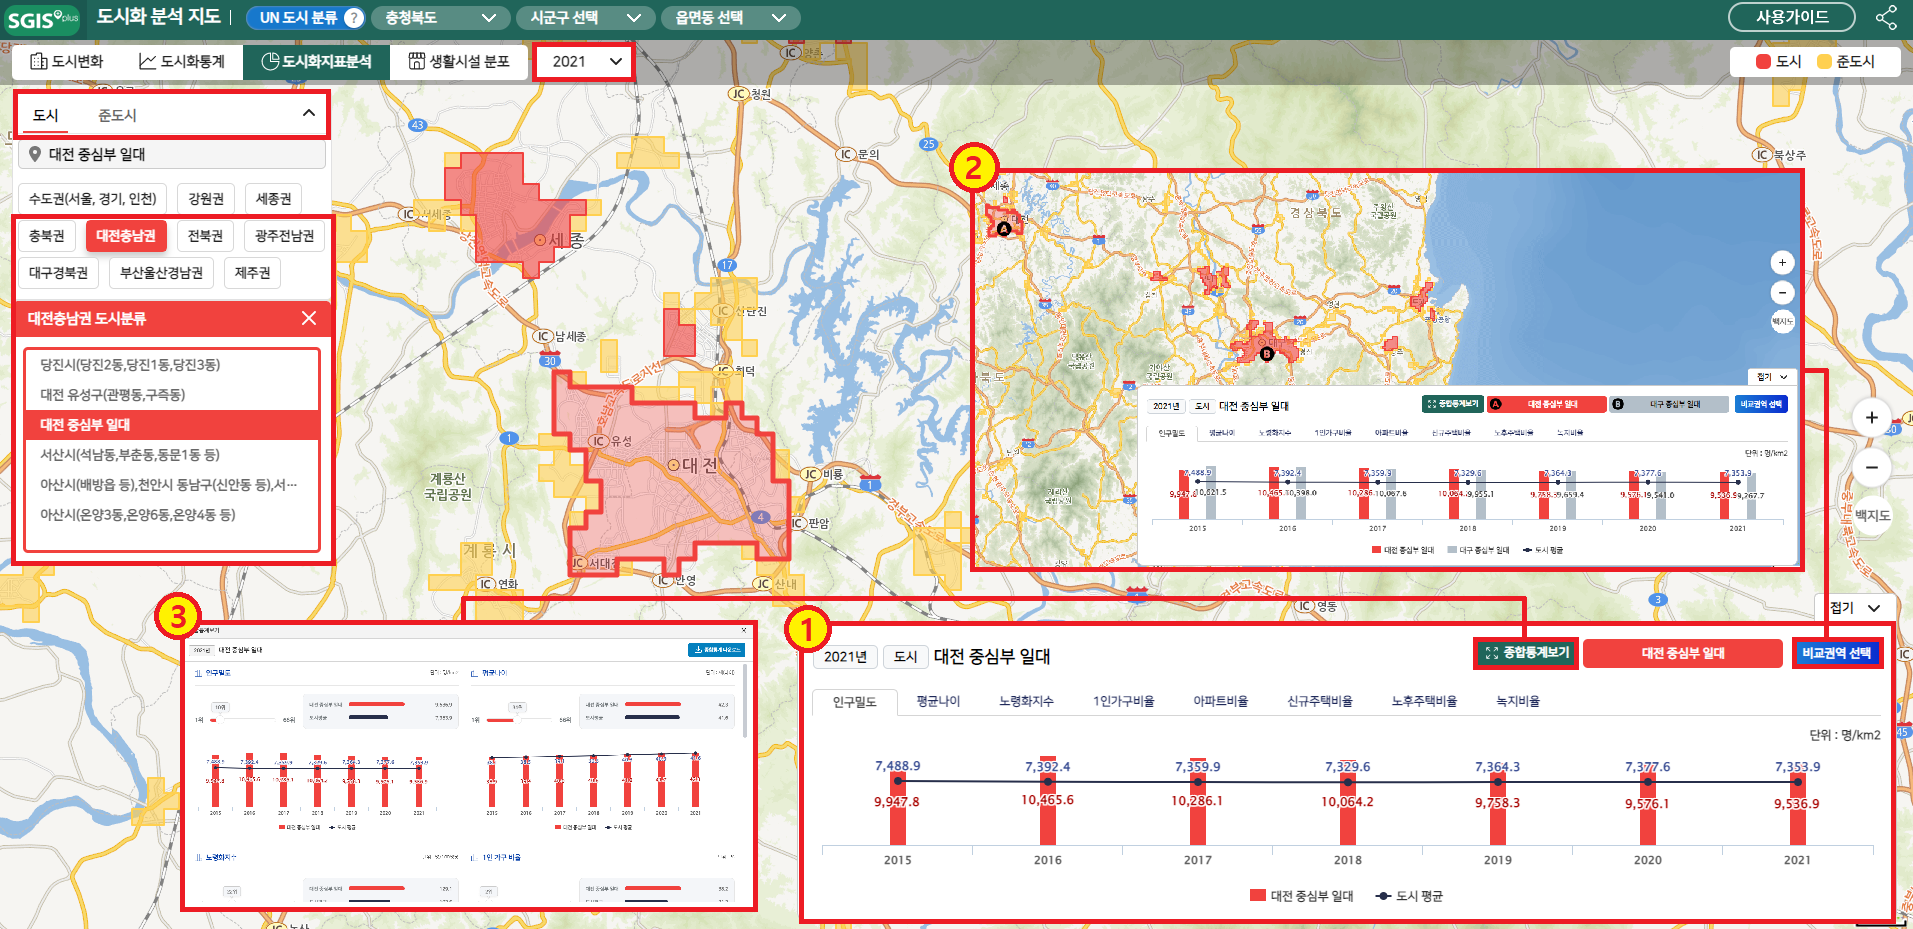
Homepage > Analysis map > Urbanization analysis map > Urbanization indicator analysis
▶ Year selection → Urban centre / Urban cluster selection → Metropolitan area selection → Urbanization area selection → Urbanization indicator retrieval
1) Users can check time series data of urbanization-related indicators (population density, average age, aging index, share of one-person households, share of apartments) and rankings of urbanization areas.
▶ Urbanization indicator retrieval → Comparison area selection → Indicator data and ranking comparison
2) Users can compare indicator data and rankings of two urbanization areas.
3) You can check indicator data and rankings at a glance through the comprehensive statistics viewing function.
Business Ecosystem Analysis Map

Service Overview
○ 'Business Ecosystem Analysis Map' is based on statistical data of enterprises in the Statistical Business Register of Statistics Korea and is composed of 8 business ecology themes for convenient use by statistical users. Through convergence with various indicators, this map provides more detailed and easier analysis experience to users.
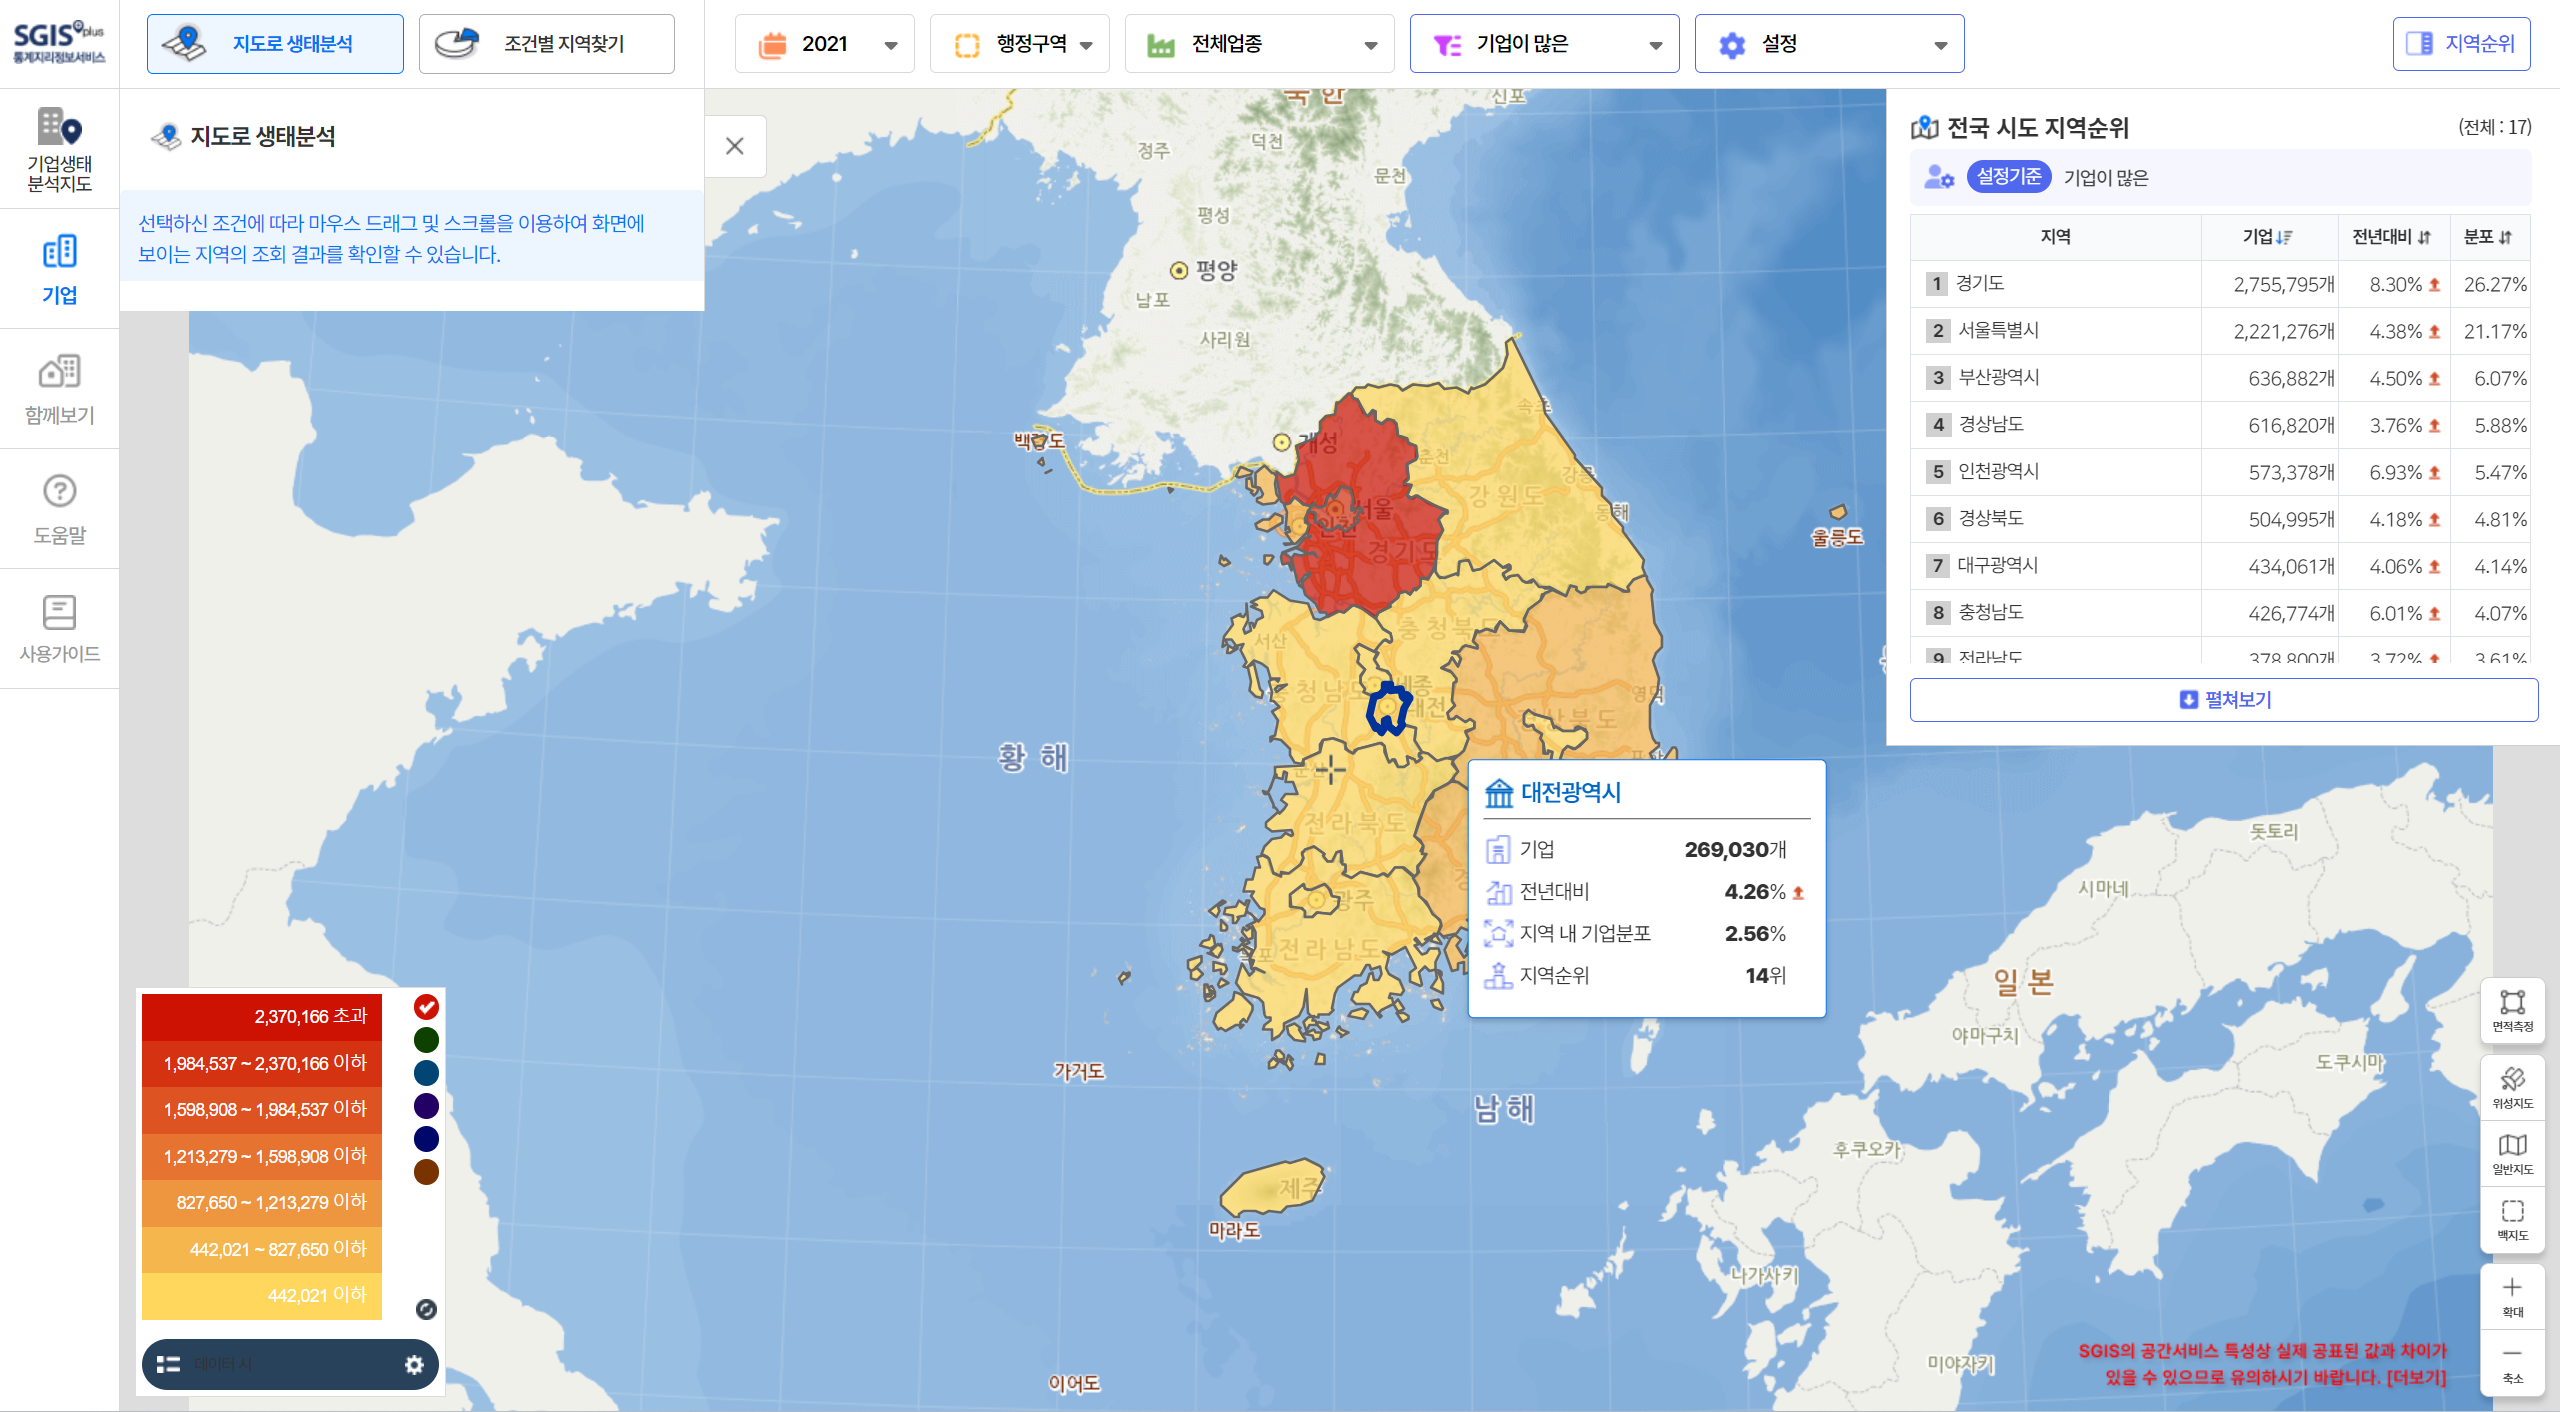
○ Go to services by clicking 'Analysis Map' > 'Business Ecosystem Analysis Map' on the SGIS website.
○ Major features
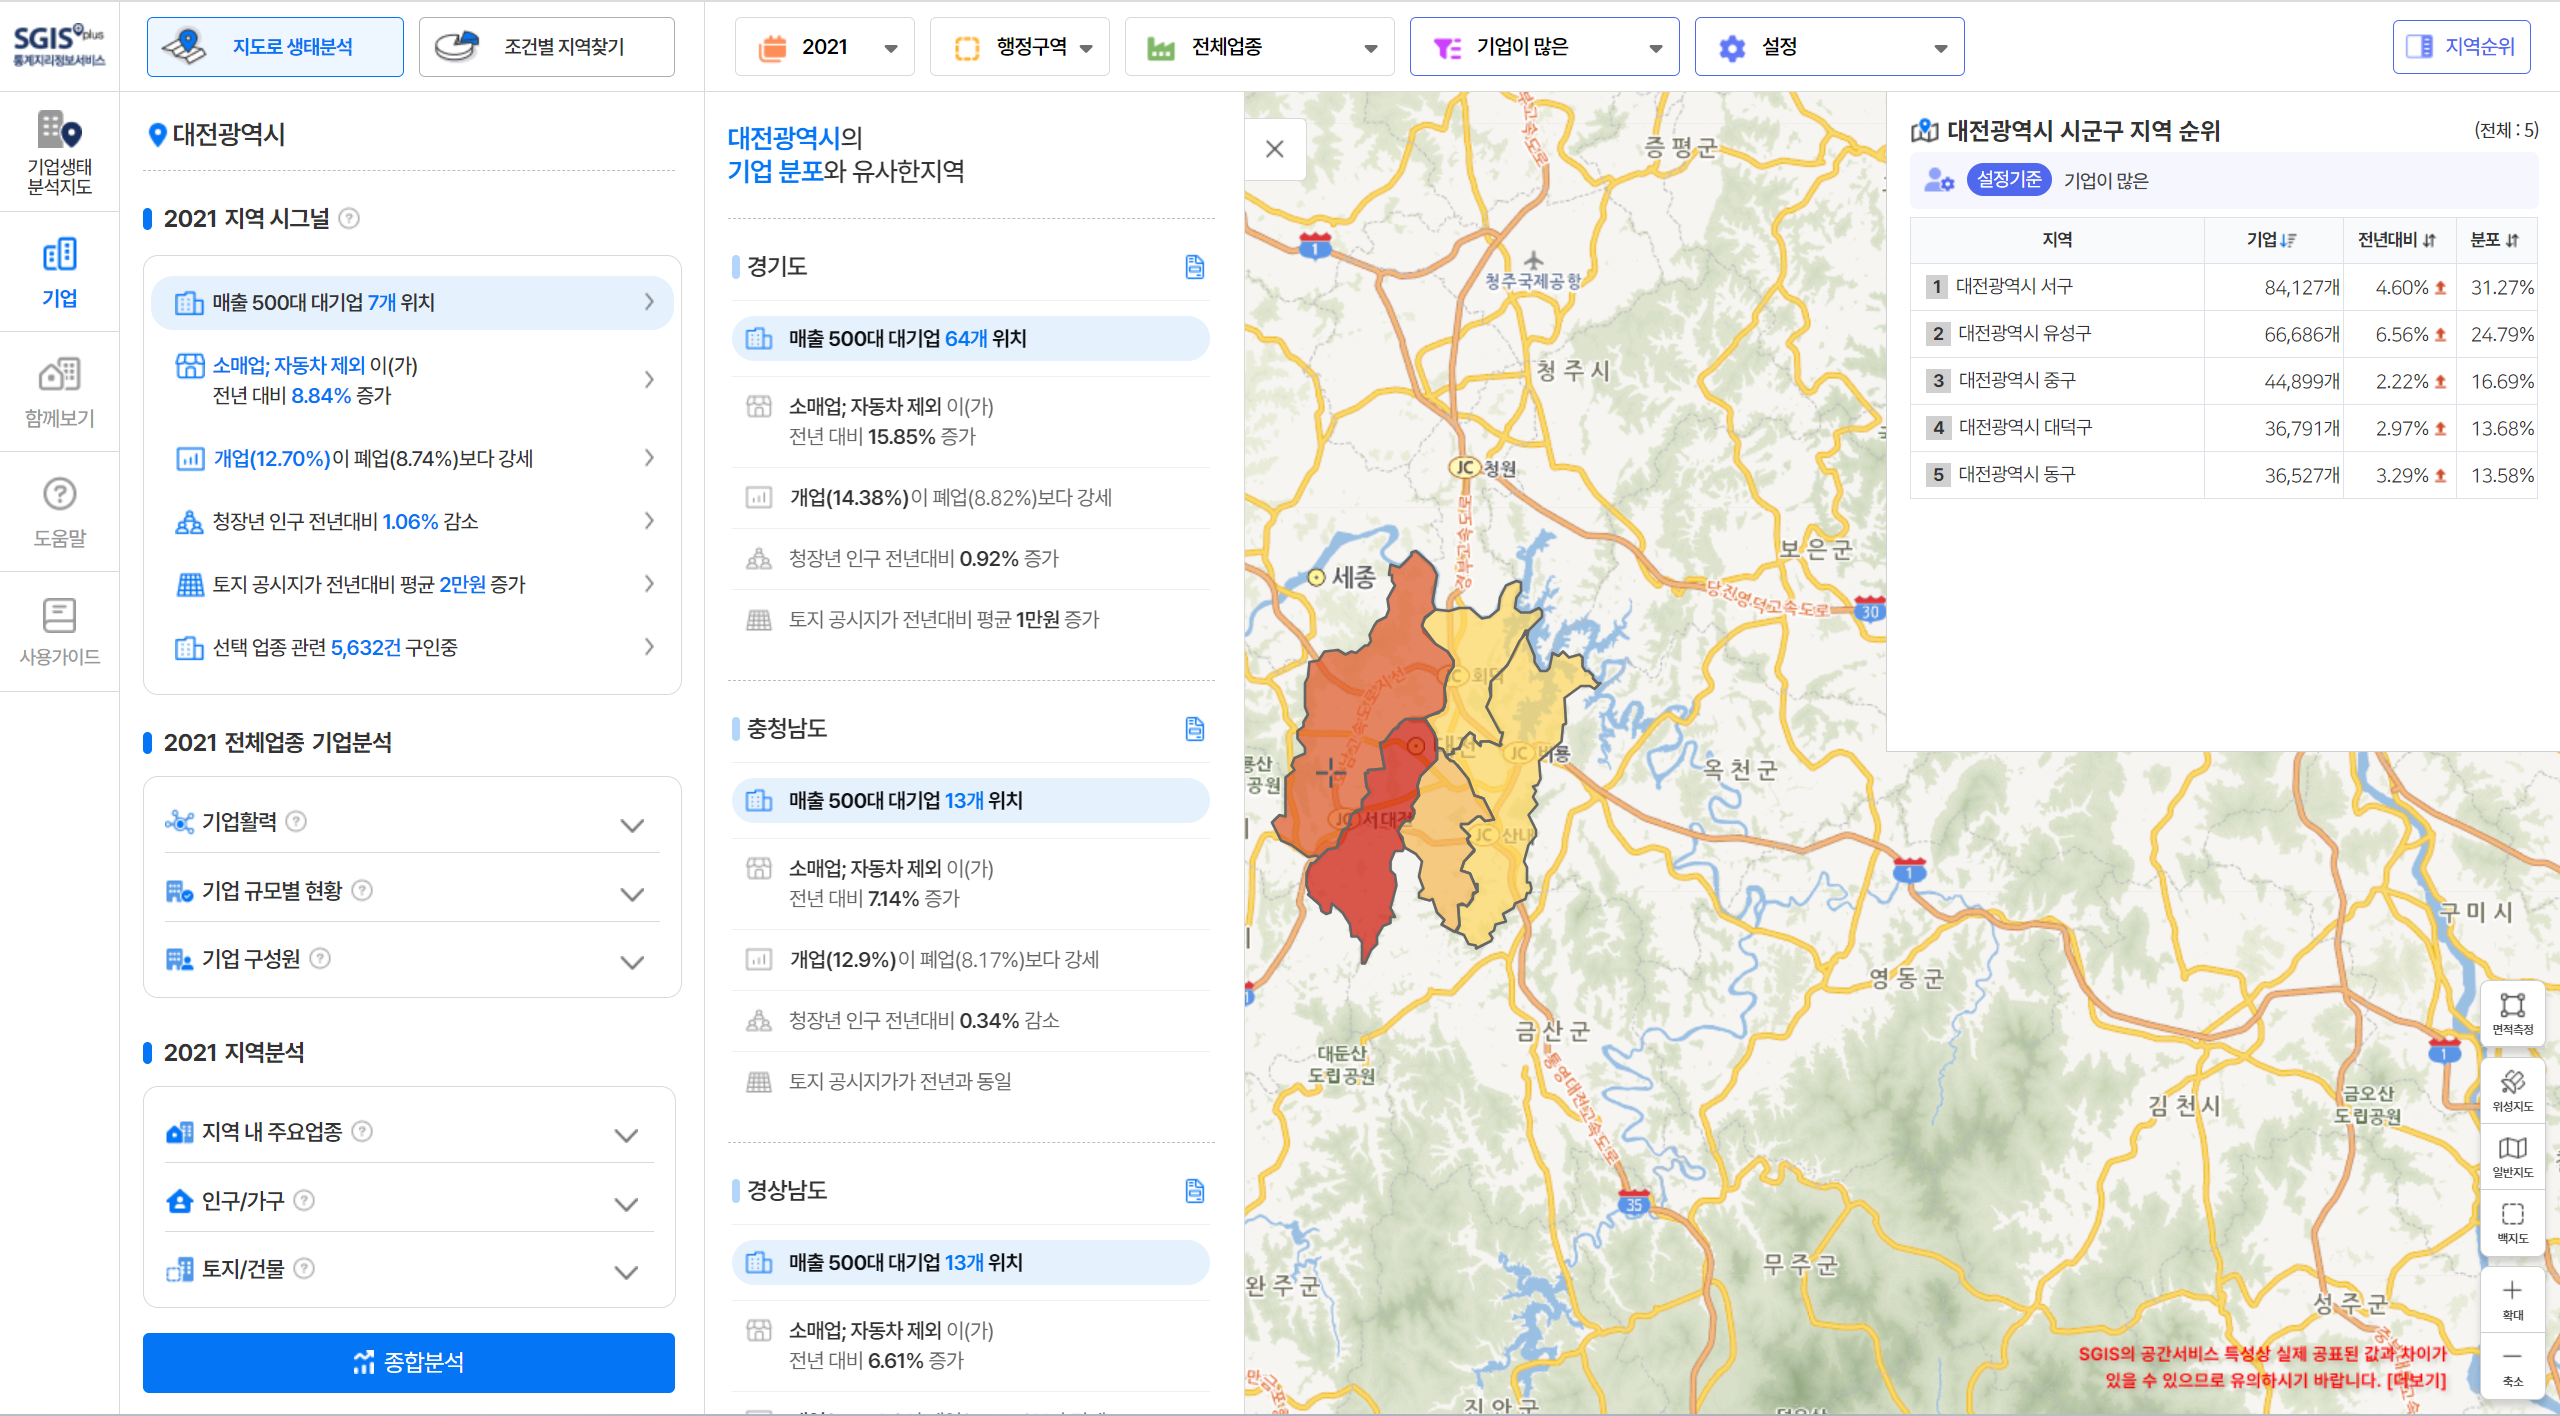
- Provides a visualization function for analyzing business ecology and finding a region by condition with a map that represents business ecology.
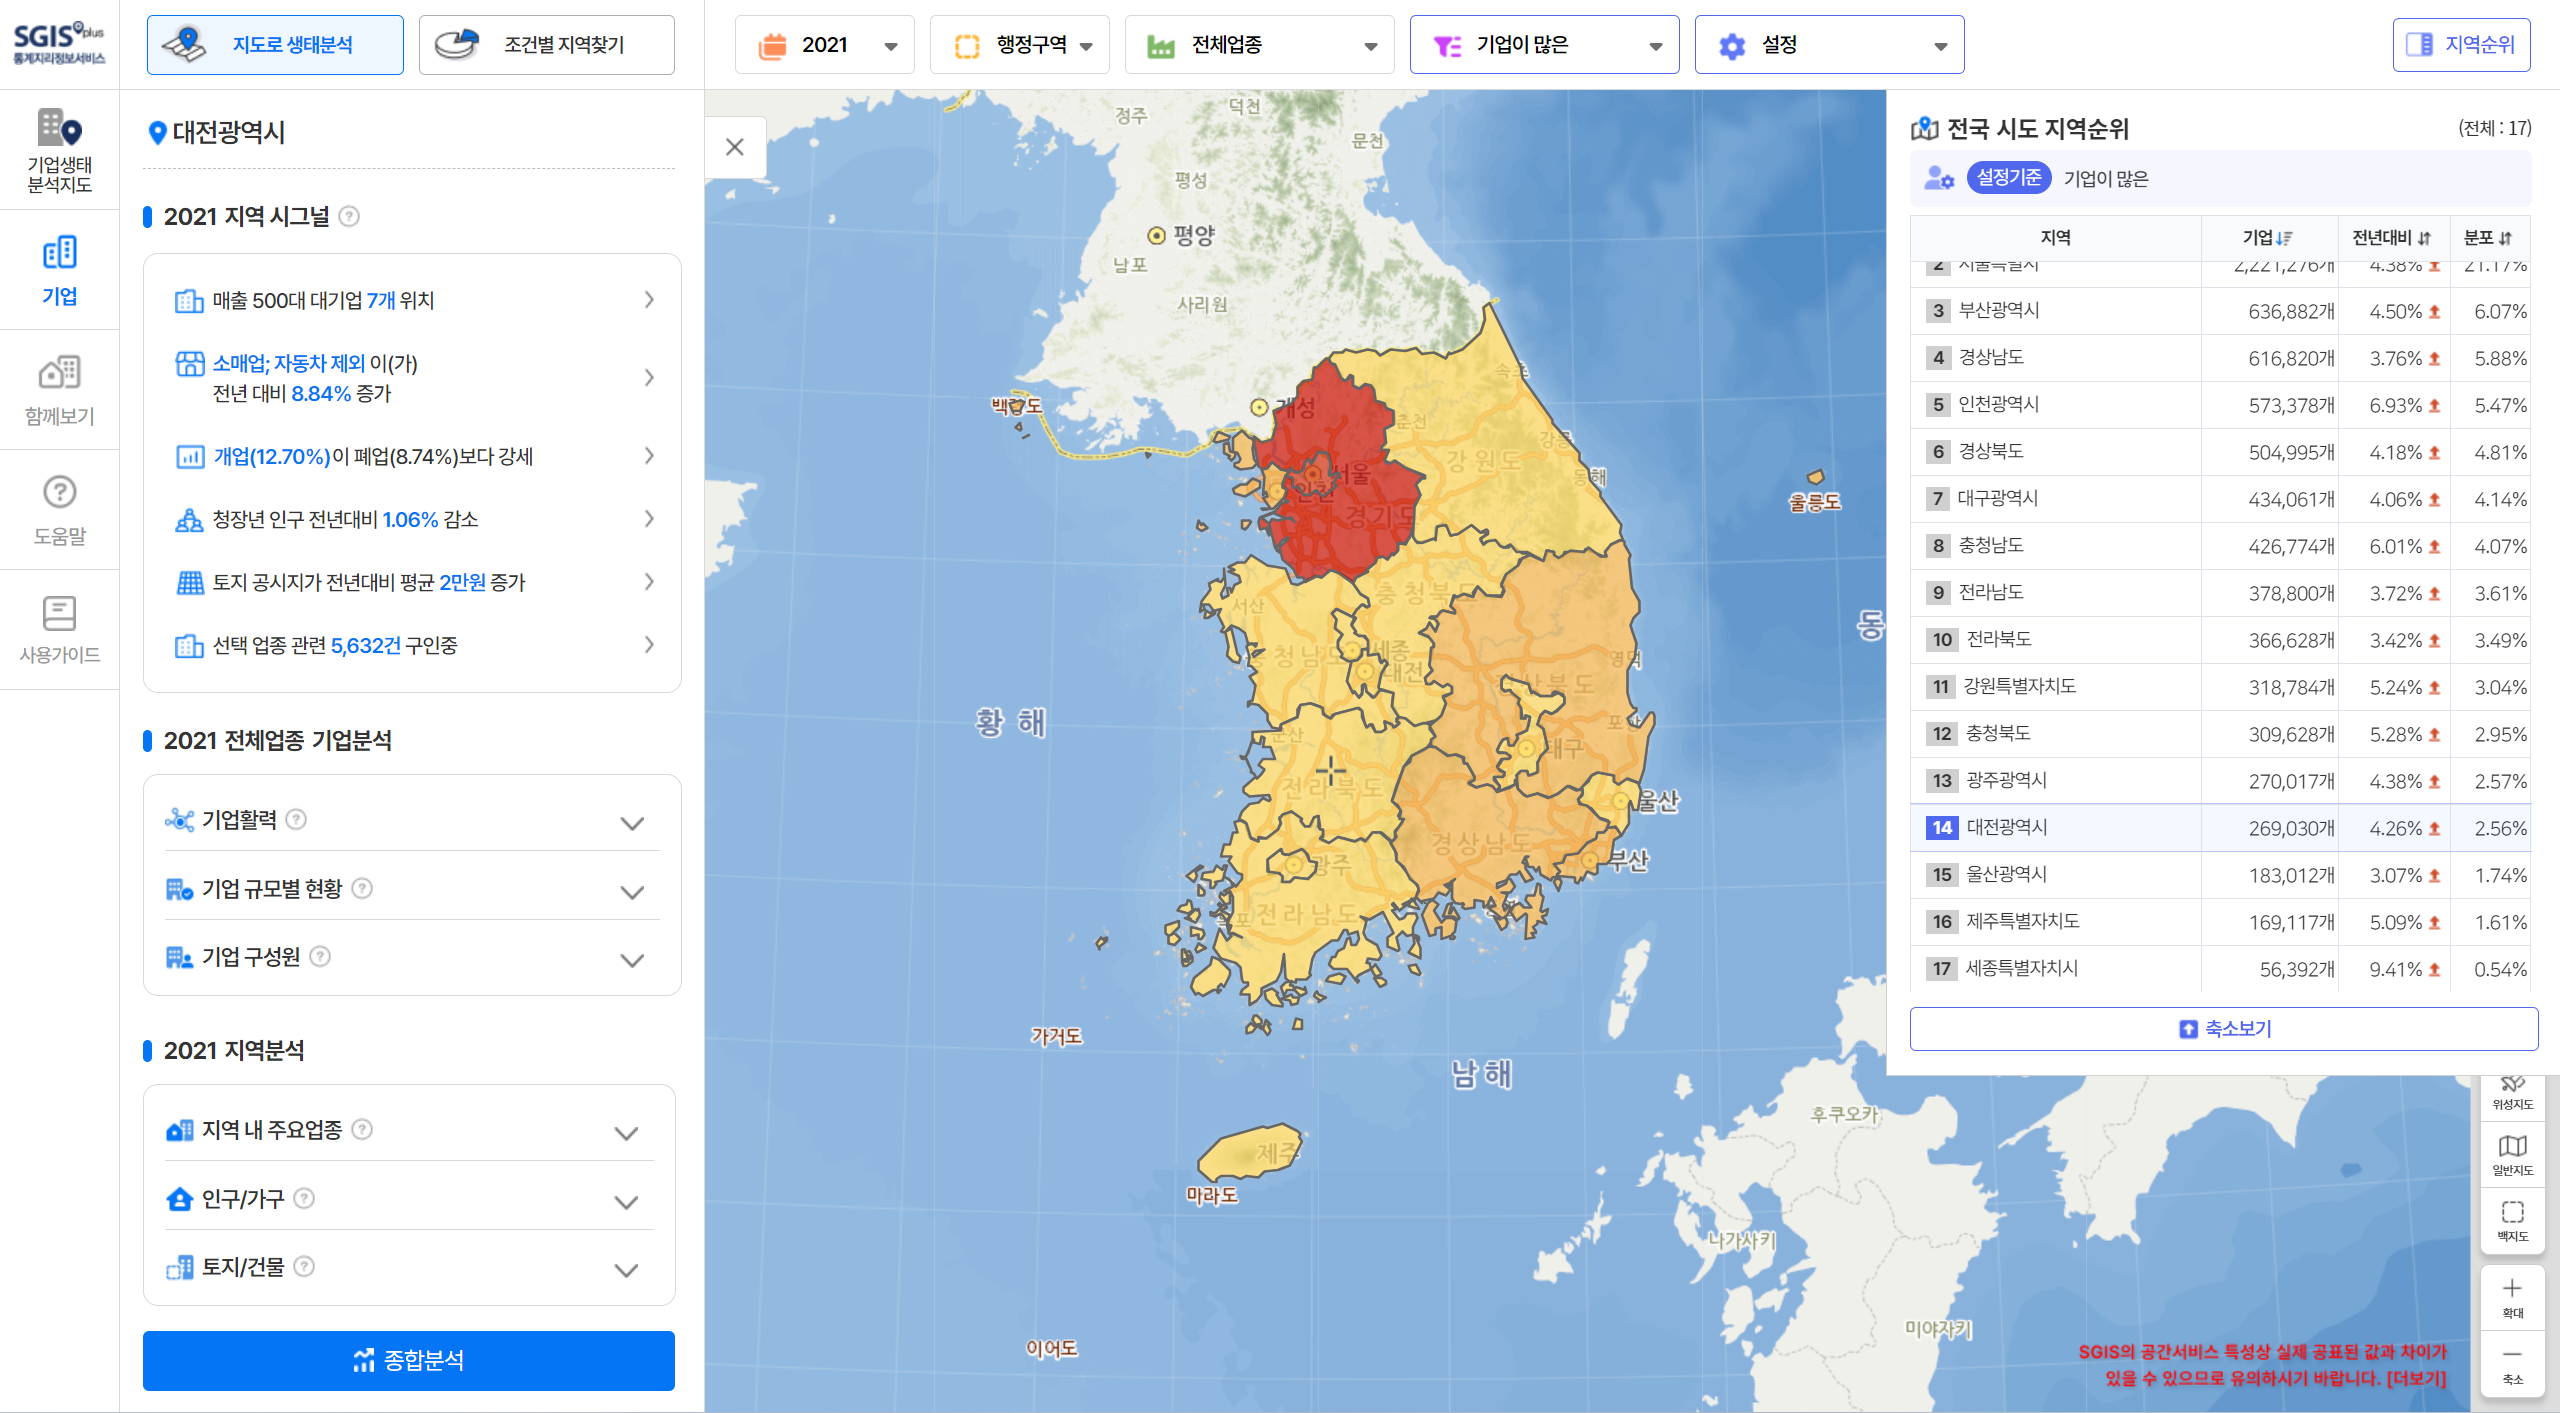
- Provides a regional analysis for checking business ecology in various ways by clicking on a specific region.
- Provides a regional signal so that users can find areas similar to the selected area, and a function to view the current job opportunities of the industry of interest.
- Provides a function to check and download comprehensive analysis results regarding industries, enterprises and spaces of the selected region.
- Provides a multi-view function to compare enterprises, population, households, housing, agriculture, forestry and fishing.
Screen Layout
Visualization Map of Administrative Statistics
Service Overview
O It provides various administrative data-based statistics that are published by Statistics Korea, in maps and charts for better understanding of statistical users.
- 7 kinds of statistics (coming from KOSIS) based on administrative records which are collected by governments and other public organizations are provided.
O (Statistics at a glance) Key indicators of each administrative statistics are provided in the form of a dashboard.
- (Dashboard) Statistics at the province/ Si, Gun & Gu level*
* Newlyweds Statistics, Statistics of House Ownership, Administrative Statistics on the Population Aged 40~64, Statistics on Returned Farmers & Fishermen, and Migrators to Rural Regions
- (More) National-Level Public Statistics*
* Employment Position Statistics, Retirement Pension Statistics, Wage Employment Position by Industrial Classification
O (Detailed Statistics View) Provides detailed item data for provincial and Si, Gun, & Gu public statistics* in the form of maps and data board screens.
* Newlyweds Statistics, Statistics of House Ownership, Administrative Statistics on the Population Aged 40~64, Statistics on Returned Farmers & Fishermen, and Migrators to Rural Regions
Screen layout
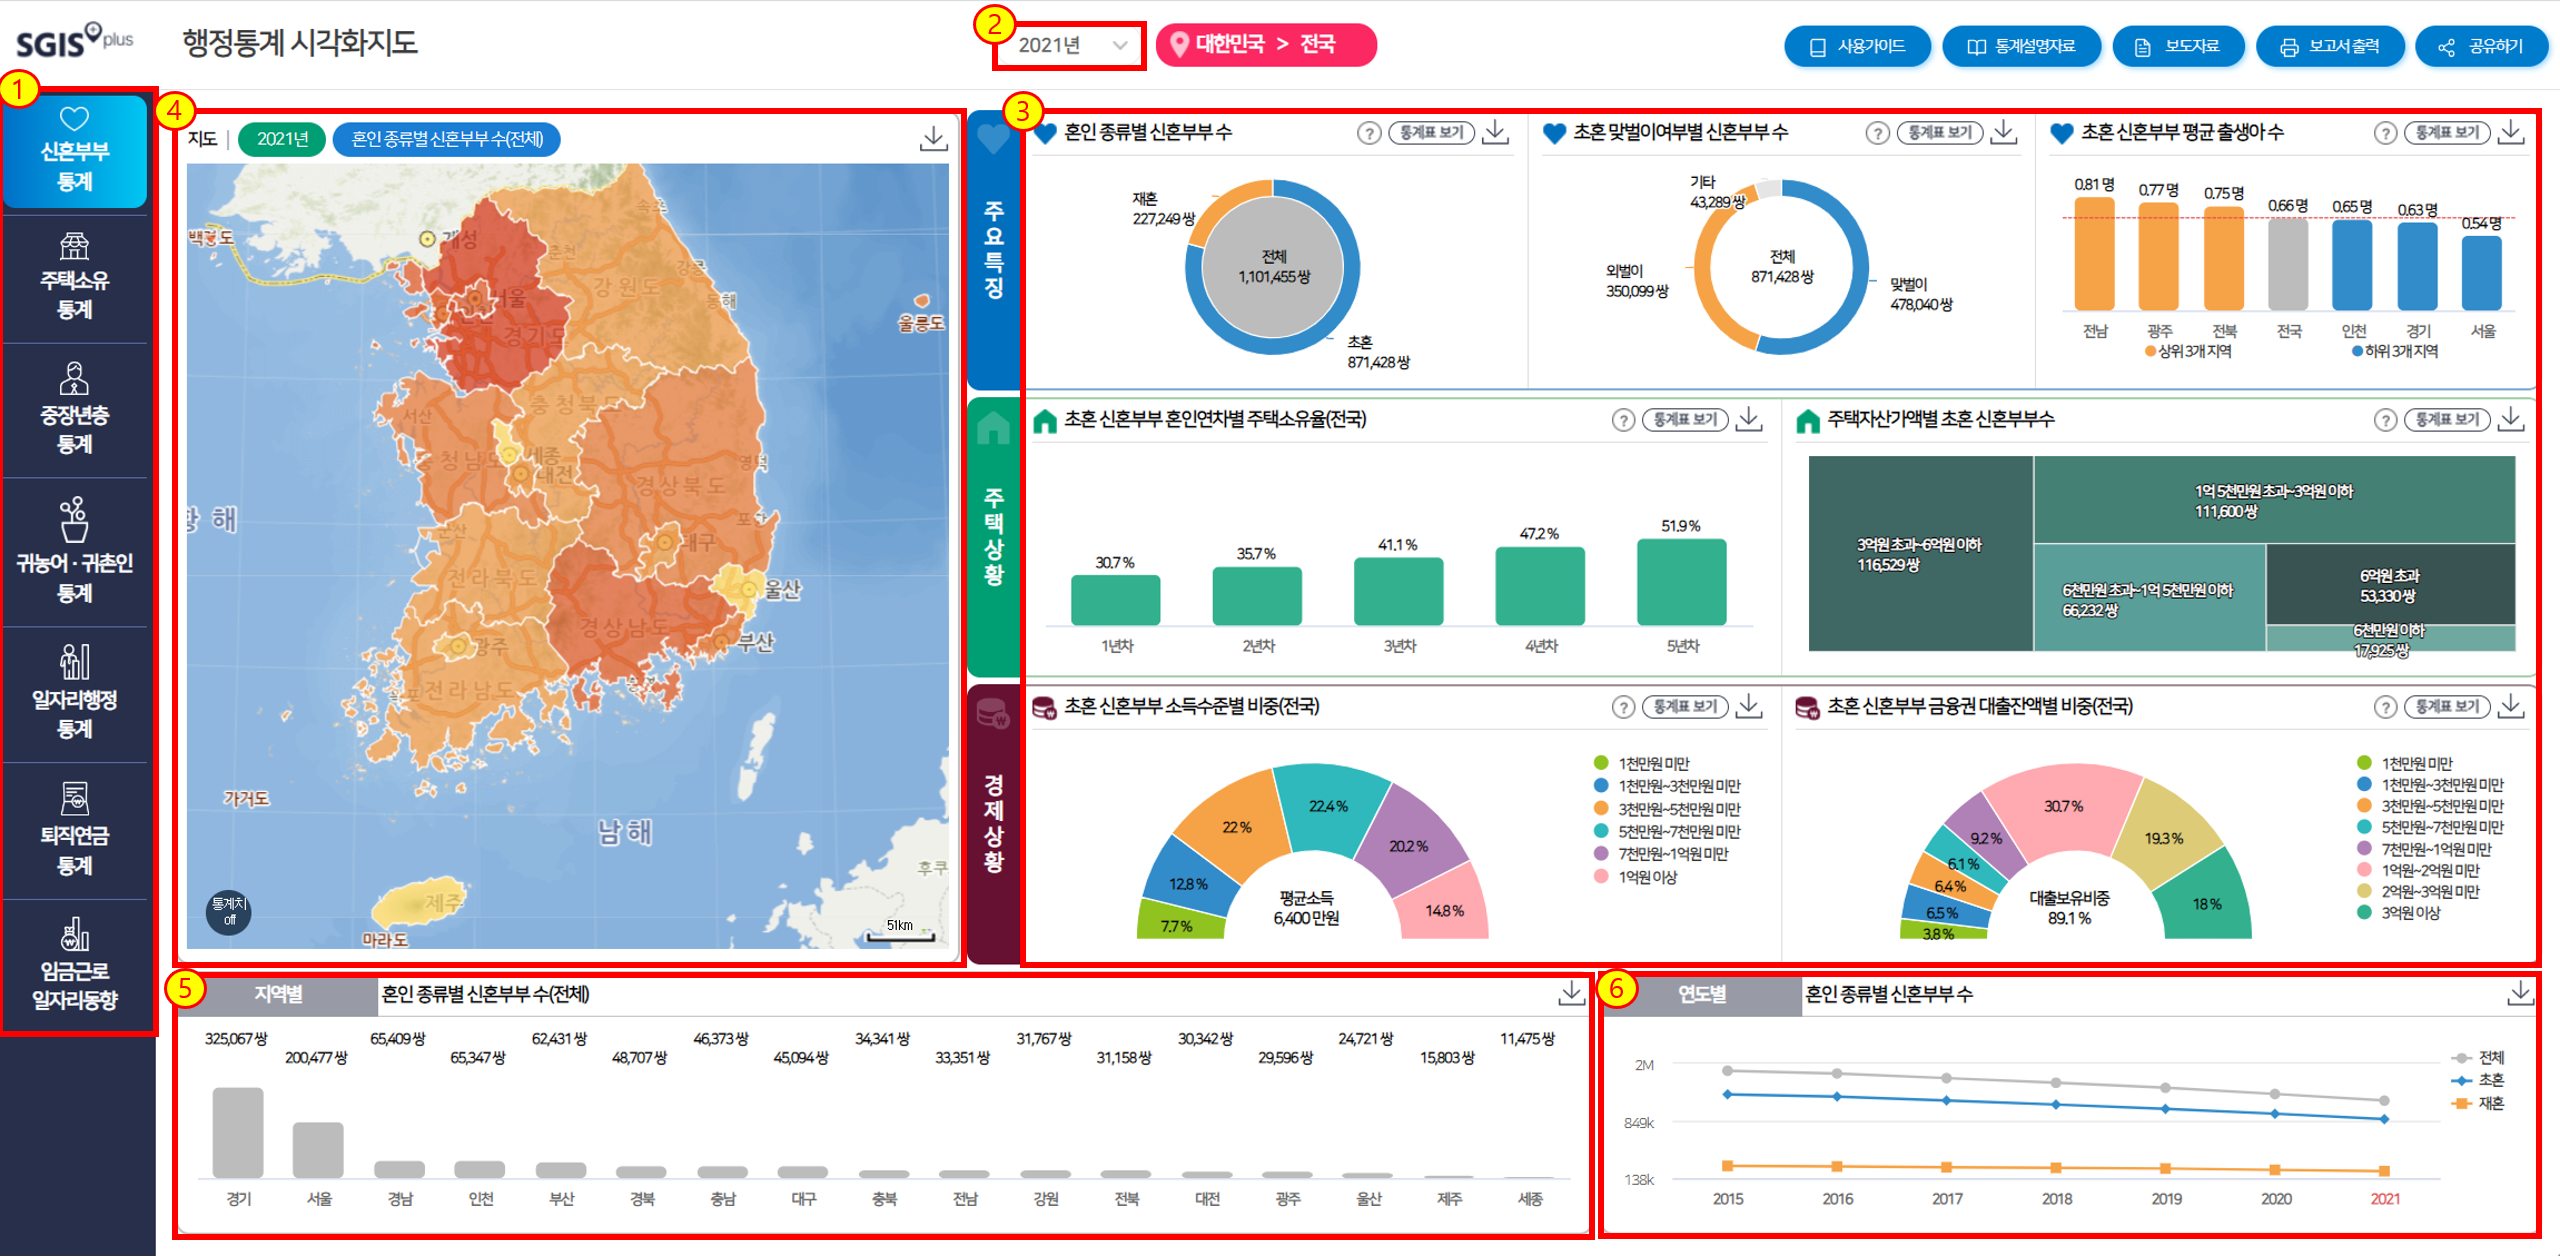
Homepage > Analysis map > Visualization Map of Administrative Statistics > Statistics at a glance
1) Users can select the title of administrative statistics that they want to search.
2) Users can set the year that they want to search.
3) Visualized charts are provided by considering the characteristics of statistical data for each statistical indicator.
4) Users can check color maps (value, share) of regional statistical data for the selected indicator (item).
5) For regional comparison, users can check charts (rank, share) of regional statistical data for the selected indicator (item).
6) Users can check time series data (value, percent change) of the selected indicator (item).
* Map, chart and comparison (by region and year) areas interact with each other when users click on an indicator (item).
Visualization Map of Census Data
Service Overview
O It is a dashboard-type service that visualizes census data (Population and Housing Census, Census of Agriculture, Forestry and Fisheries) of Statistics Korea in maps and charts, so that users can check the statistical results at a glance.
O Users can find visualized data of the Population and Housing Census (population, households, housing) and the Census of Agriculture, Forestry ad Fisheries.
O Users can easily and conveniently find statistics of interest by using maps showing spatial information and charts showing statistical data.
O To facilitate the utilization and citation of statistical results, we provide functions to share information via social media and to download contents by section.
O By visualizing census data with standardized maps and charts, it is possible to check information more intuitively than in the statistical table or text format.
Screen Layout
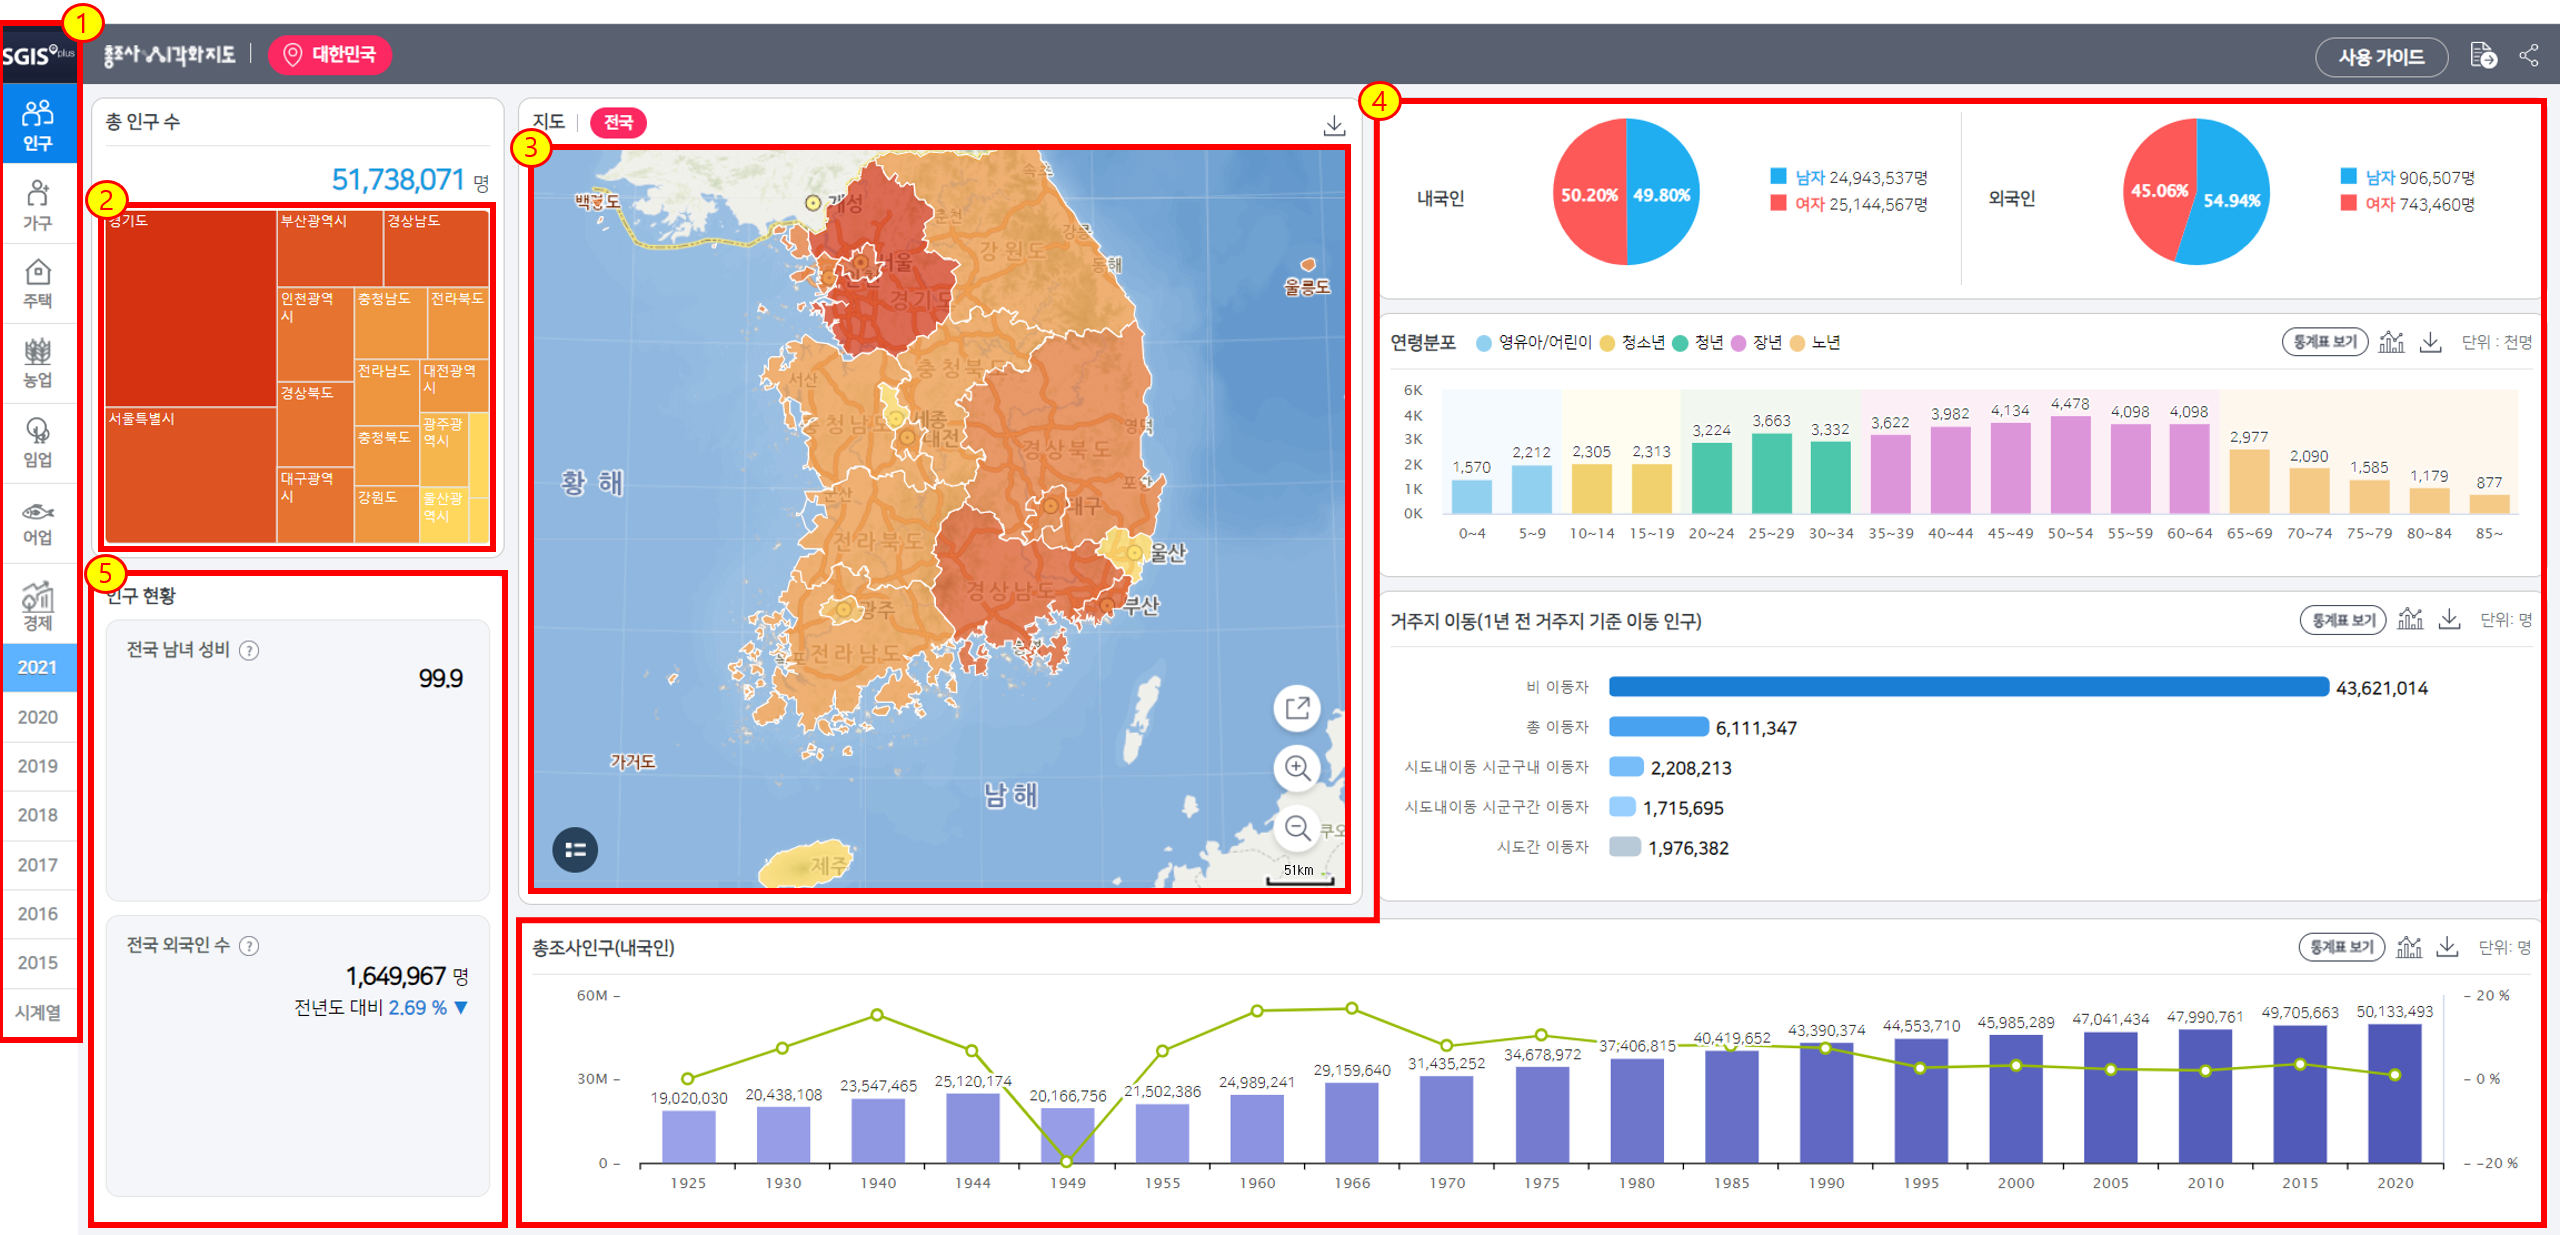
Homepage > Application > Visualization Map of Census Data
1) Menu and year: Users can set the menu and year to search.
2) Region setting: Users can set the region to search.
3) Visualized map: A visualized map of statistical information is displayed. In addition, when selecting a regional boundary, statistical information of the region is expressed in a chart.
4) Chart area: Statistical information of the set area is expressed as charts. When a specific indicator in the chart area is selected, the relevant information is visually displayed on the map.
5) Rank setting: Users can check the ranking information of each region. When moving the ranking, the region of the specific ranking is selected.
Time series data screen
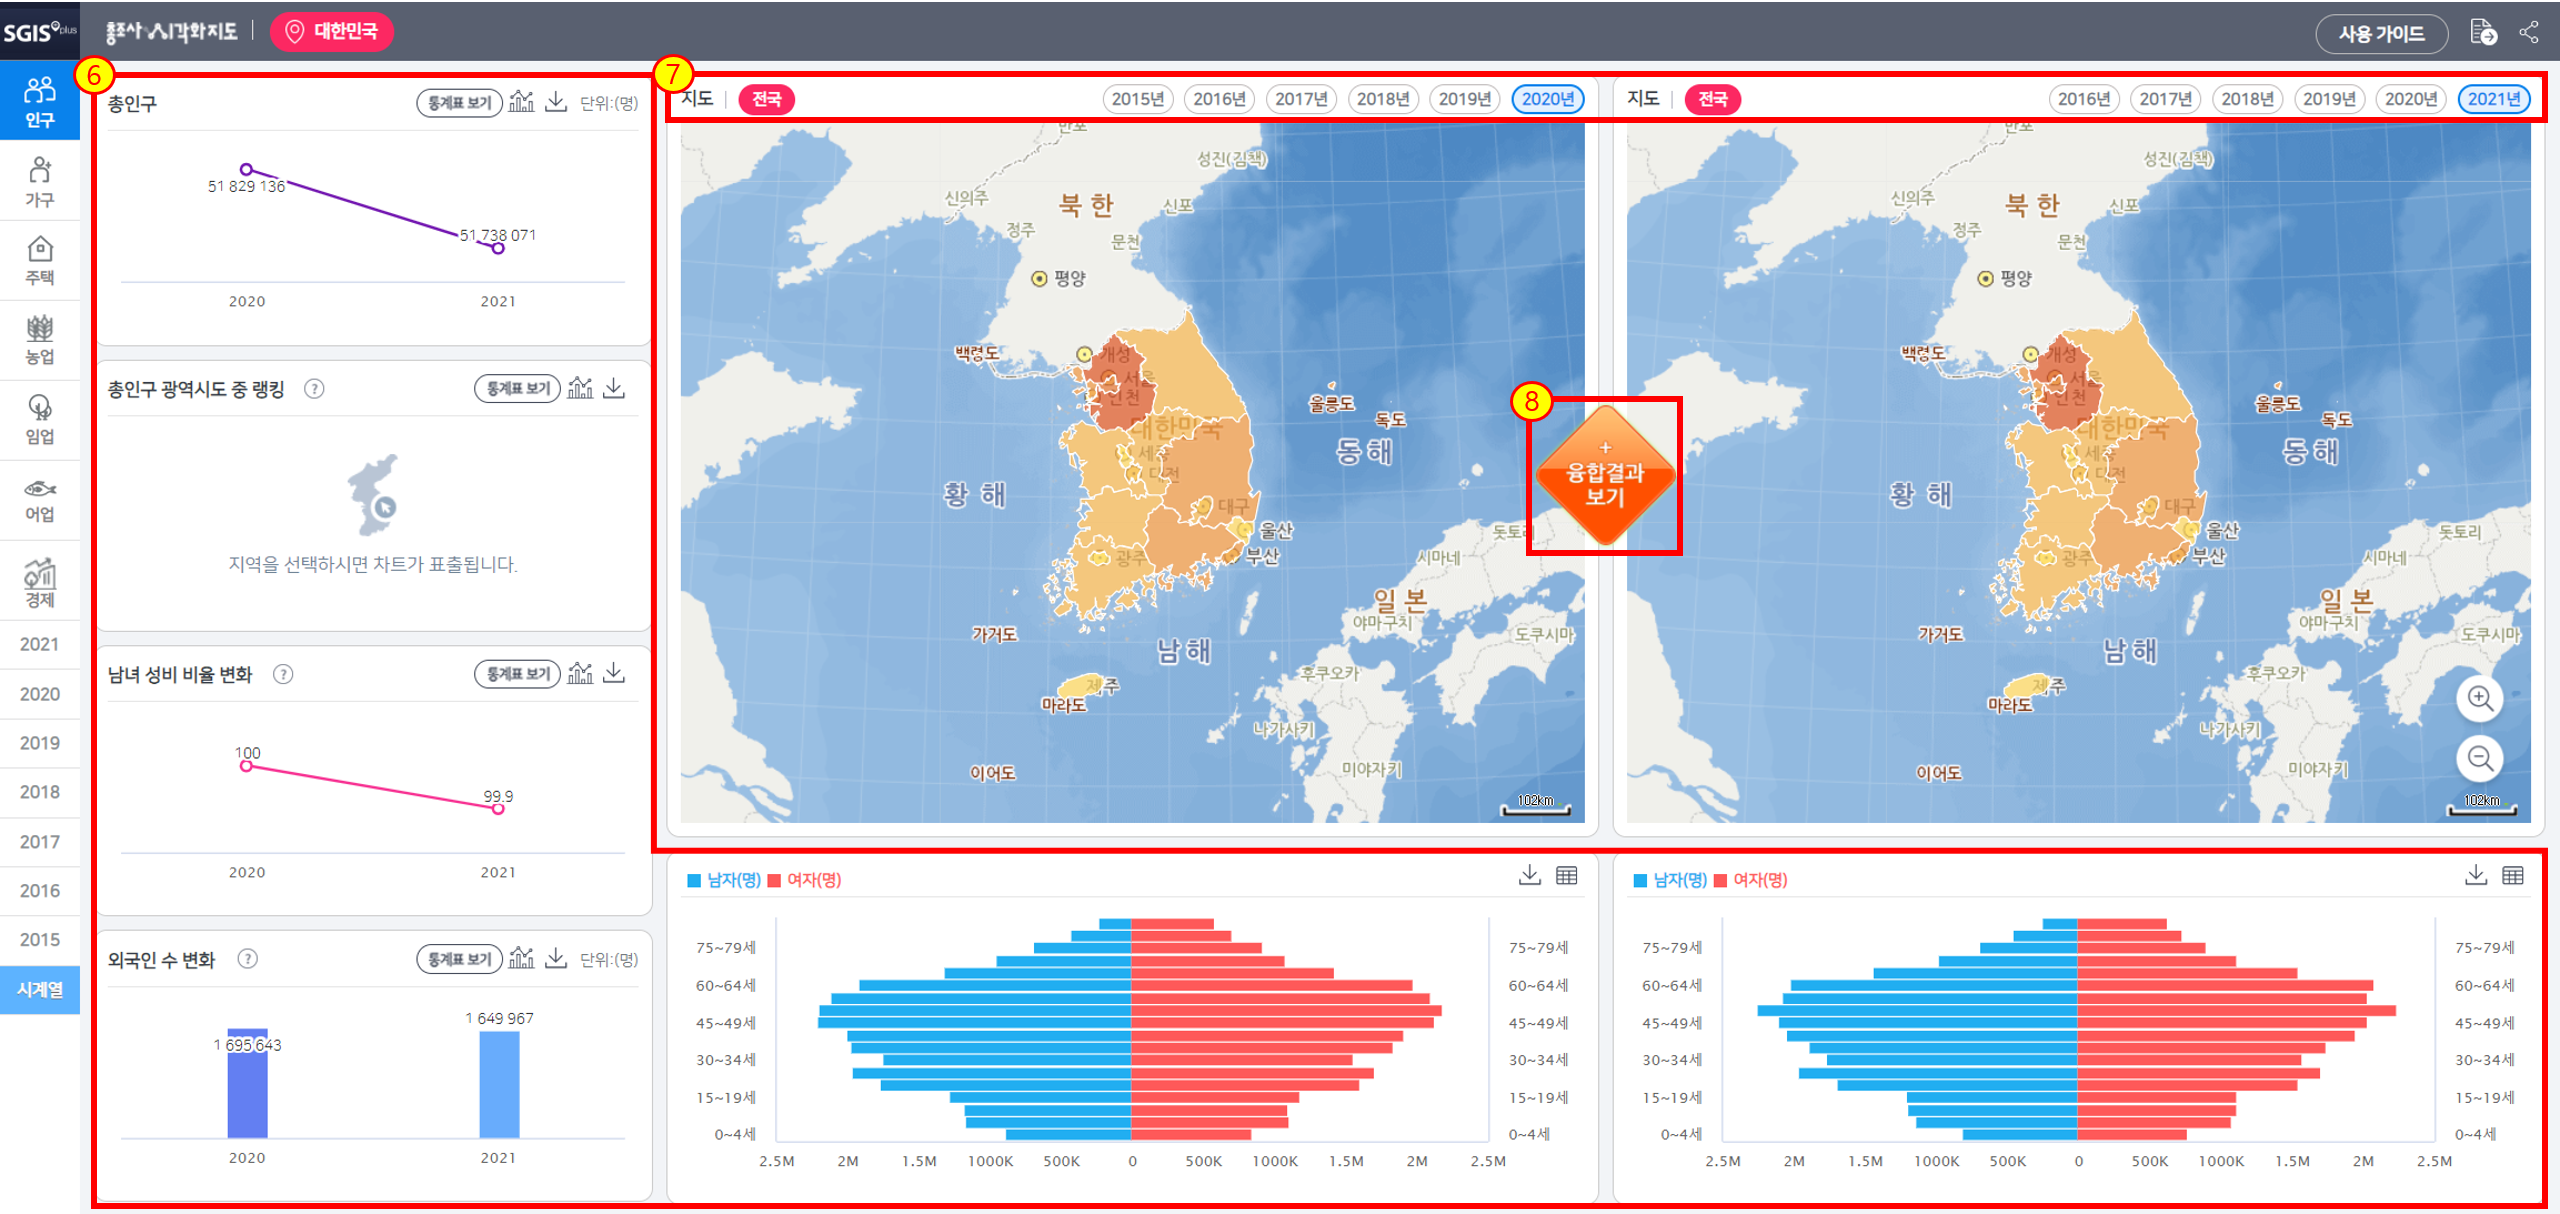
Homepage > Application > Visualization Map of Census Data > Time series
6) Time series chart area: Statistical data of the consecutive years are displayed as charts.
7) Time series year setting: Users can set years that they want to retrieve.
8) Convergence view: By combining the selected map information, information on increase (or decrease) is visually displayed.
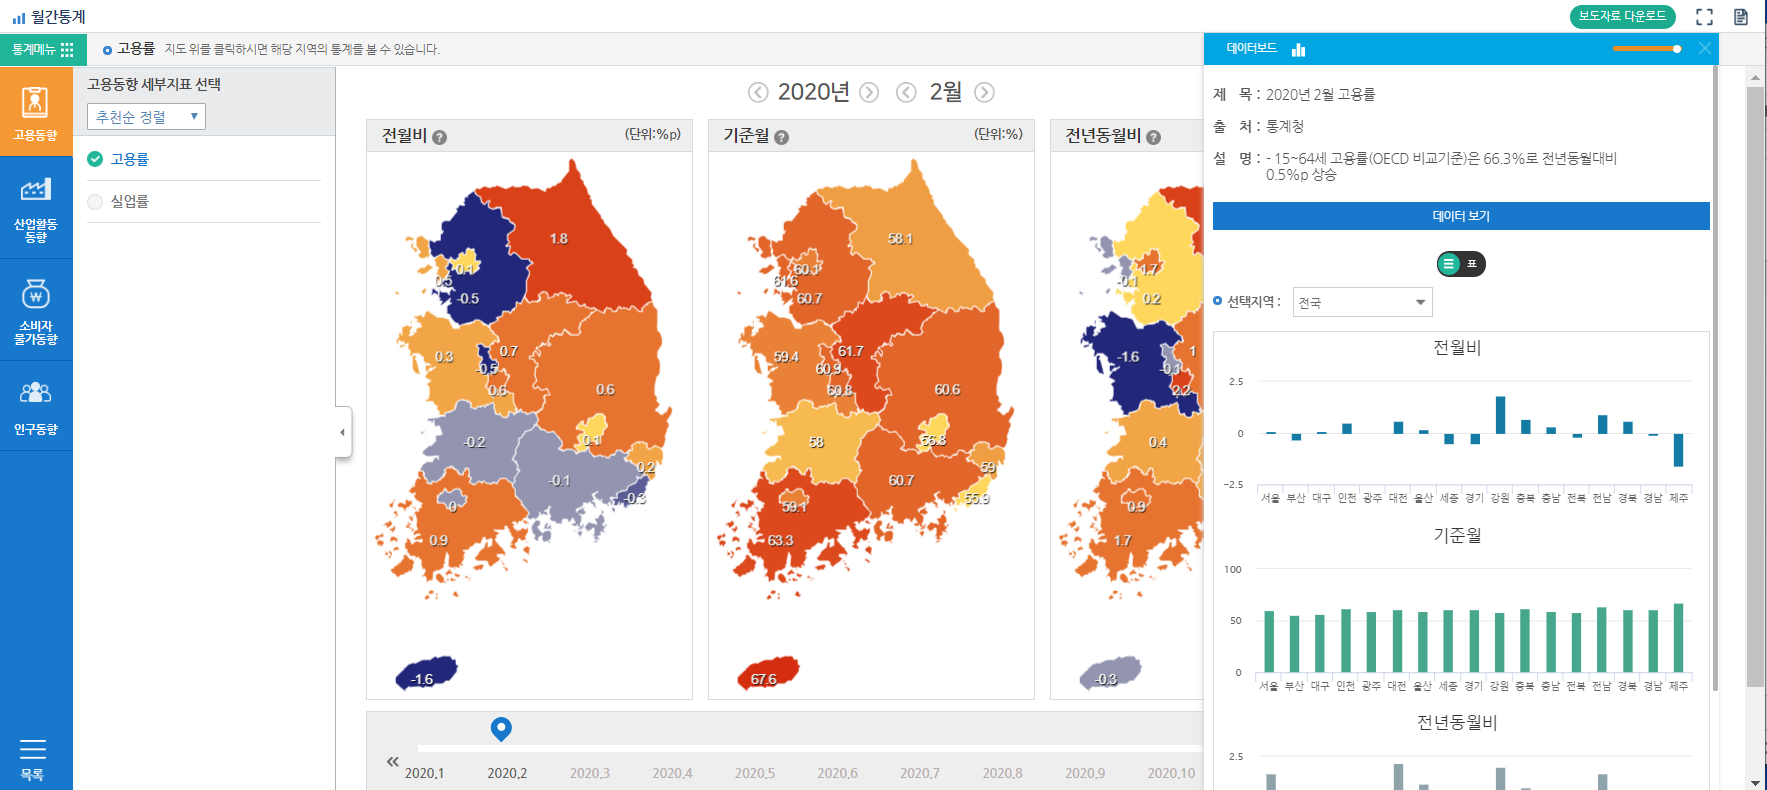
Monthly Statistics
Service Overview
○ 'Monthly statistics' is a service that shows the monthly statistical information such as the consumer price index and the unemployment rate into three types of statistics such as monthly statistics, month-to-month, and year-to-date.
○ The statistical information is provided on a monthly basis since 2008, and the statistics of the provincial level for the statistical item are displayed on the map.
○ Detailed information such as summary information, units, and arithmetic expressions for statistical items are provided.
○ Provided statistical items
- Employment trends: Employment rate, unemployment rate
- Industrial activity trends: Mining industry index (production / shipment / inventory), default rate, large retail sales index
- Consumer Price Trend: Consumer Price Index, Life Price Index
- Population Trends: Number of births, number of deaths, number of marriages, number of divorces
Screen Layout
Population Pyramid
Service Overview
○ 'Population Pyramid' can be graphically plotted for future population changes, taking into account the defined population for the past population and future population changes (birth, death, international migration).
○ Service Contents
- Population pyramids by year and age (1960~2070)
- Population pyramids by age, year and province (2000~2050)
- Indicates the percentage of population by birth year and current year to indicate survival rate
- It shows a comparison of population structure changes among regions by contrasting them with national population changes.
○ Population growth assumption
- High Assumption: Calculated based on a high level of birth rates and life expectancy.
- Low Assumption: Calculated based on a low level of population growth expectancy.
- Medium Assumption: Calculated based on a midpoint between high and low expectancy.
Screen Layout
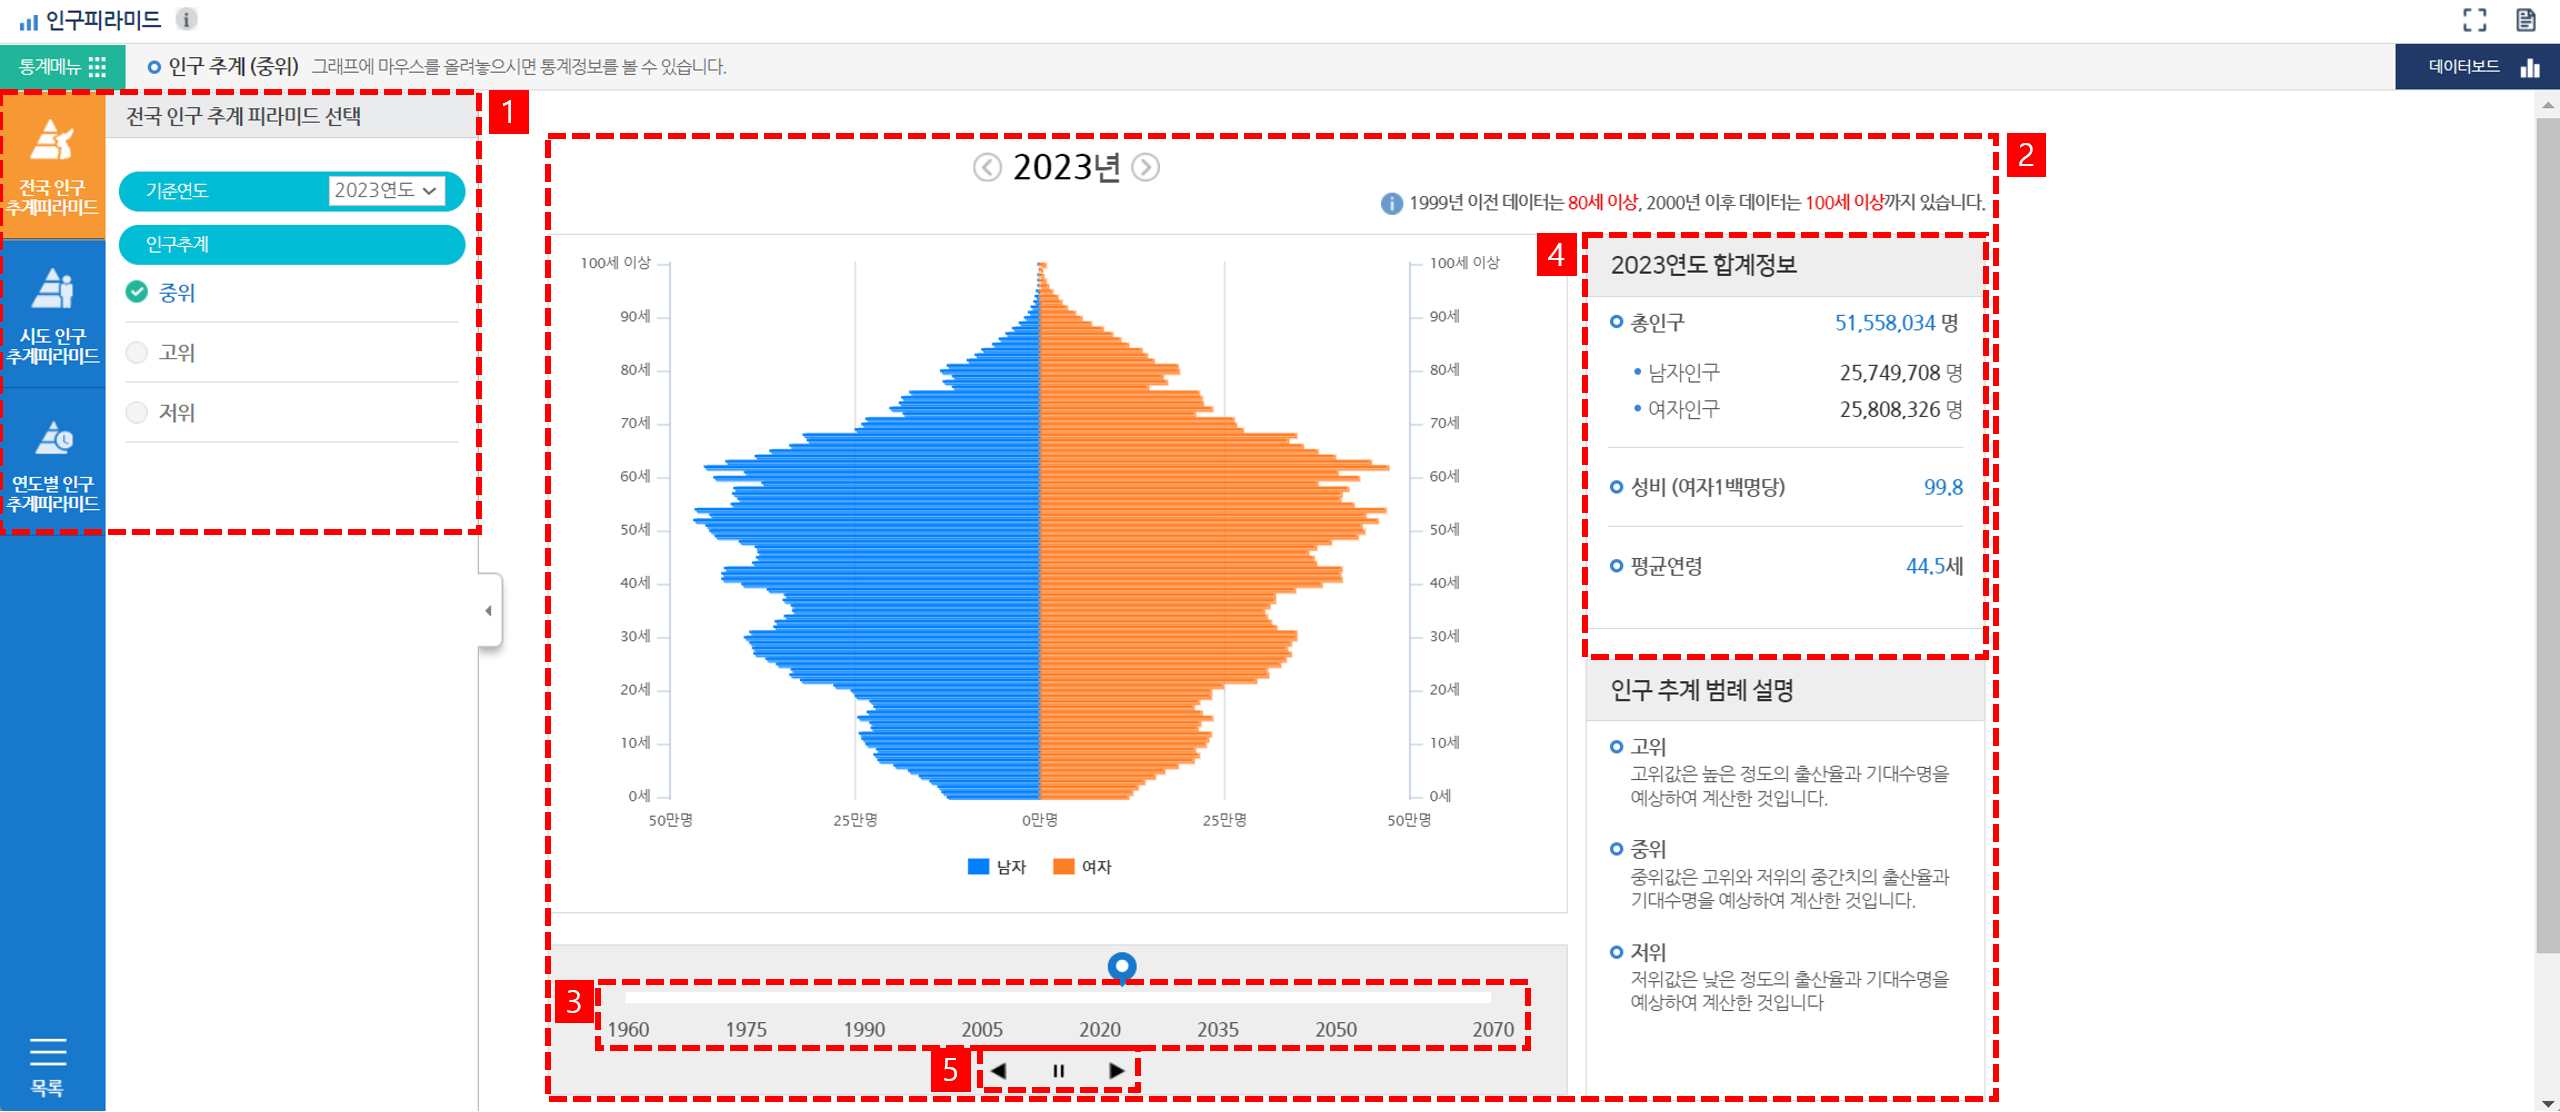
1) Choose a nationwide population-specific population-based pyramid.
2) Select the base year and birth year to display the population pyramid.
3) You can view the population pyramid by selecting the slider.
4) You can see the total population of the year, the number of male and female population, the sex ratio and the average age.
5) Continuous view: Population estimation information is displayed continuously.
Aging Status View
Service Overview
○ 'Aging Status View' is a service that provides various statistics related to aging in an increasingly aging society, and provides information on aging trends, aging trends, and welfare facilities.
○ Main Features
- Aging Theme Map: It is a service that displays the elderly population (percentage), the proportion of the elderly population, etc. at the Si, Gun, & Gu/Eup, Myeon, & Dong levels in the form of a color map.
- Provision of Adjacent Area Statistics: When displaying aging statistics between regions, it simultaneously provides statistics for the adjacent areas of the relevant Si, Gun, & Gu.
- Provision of Various Charts: Depending on the characteristics of the statistics, we offer visualizations in various forms, including tables, graphs, pie charts, and analytical charts.
- Welfare facility theme map: Displays the location of major welfare facilities for seniors on the map.
○ Statistical information provided
- Comparison of current situation: Aging theme, comparison of aging trends among regions, number of people receiving basic living, how to prepare living expenses, etc.
- Trend analysis: Provides statistical and analysis results such as changes in past / future demographic structure and diagnosis of aging trends
- Welfare facilities: theme of welfare facilities, elderly housing / medical / leisure welfare facilities, etc.
Screen Layout
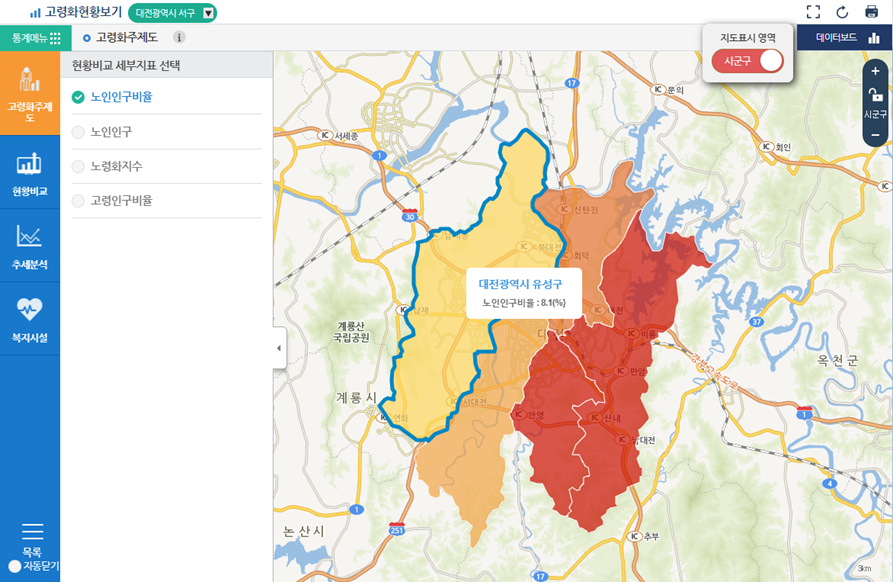
○ As specific services, there are comparisons of the aging status between regions and an analysis of aging trends.
- Comparison of Aging Status Between Regions: You can compare the degree of aging in different regions.
- Aging Trend Analysis: You can find out the level of aging by region and the level of aging expected in the coming years.
- It can be helpful in making aging policies, especially in regions where the elderly population is increasing significantly.
- Elderly Welfare Facility Analysis: You can view regional elderly welfare facility information on a map.
Surname Distribution
Service Overview
○ 'Surname Distribution' is a service that allows you to compare the population ratio and the changes from the past to the surname of the country and the ancestral origin in each region.
○ For each surname and ancestral origin, it displays the population distribution and historical population changes at the Si, Gun, & Gu level nationwide in the form of a color map.
○ Surname distribution statistics provide 15-year cycle statistics
○ Service Contents
- Surname Population Distribution: Population-to-Population Ratio Service for the top 50 surnames, 1985, 2000, and 2015.
- Ancestral Origin Population Distribution: A service that provides the population and population ratios for the top 99 ancestral origins in 1985, 2000, and 2015.
- Comparison of Population Distribution Change: Simultaneous display of population map of 1985, 2000, and 2015.
Screen Layout
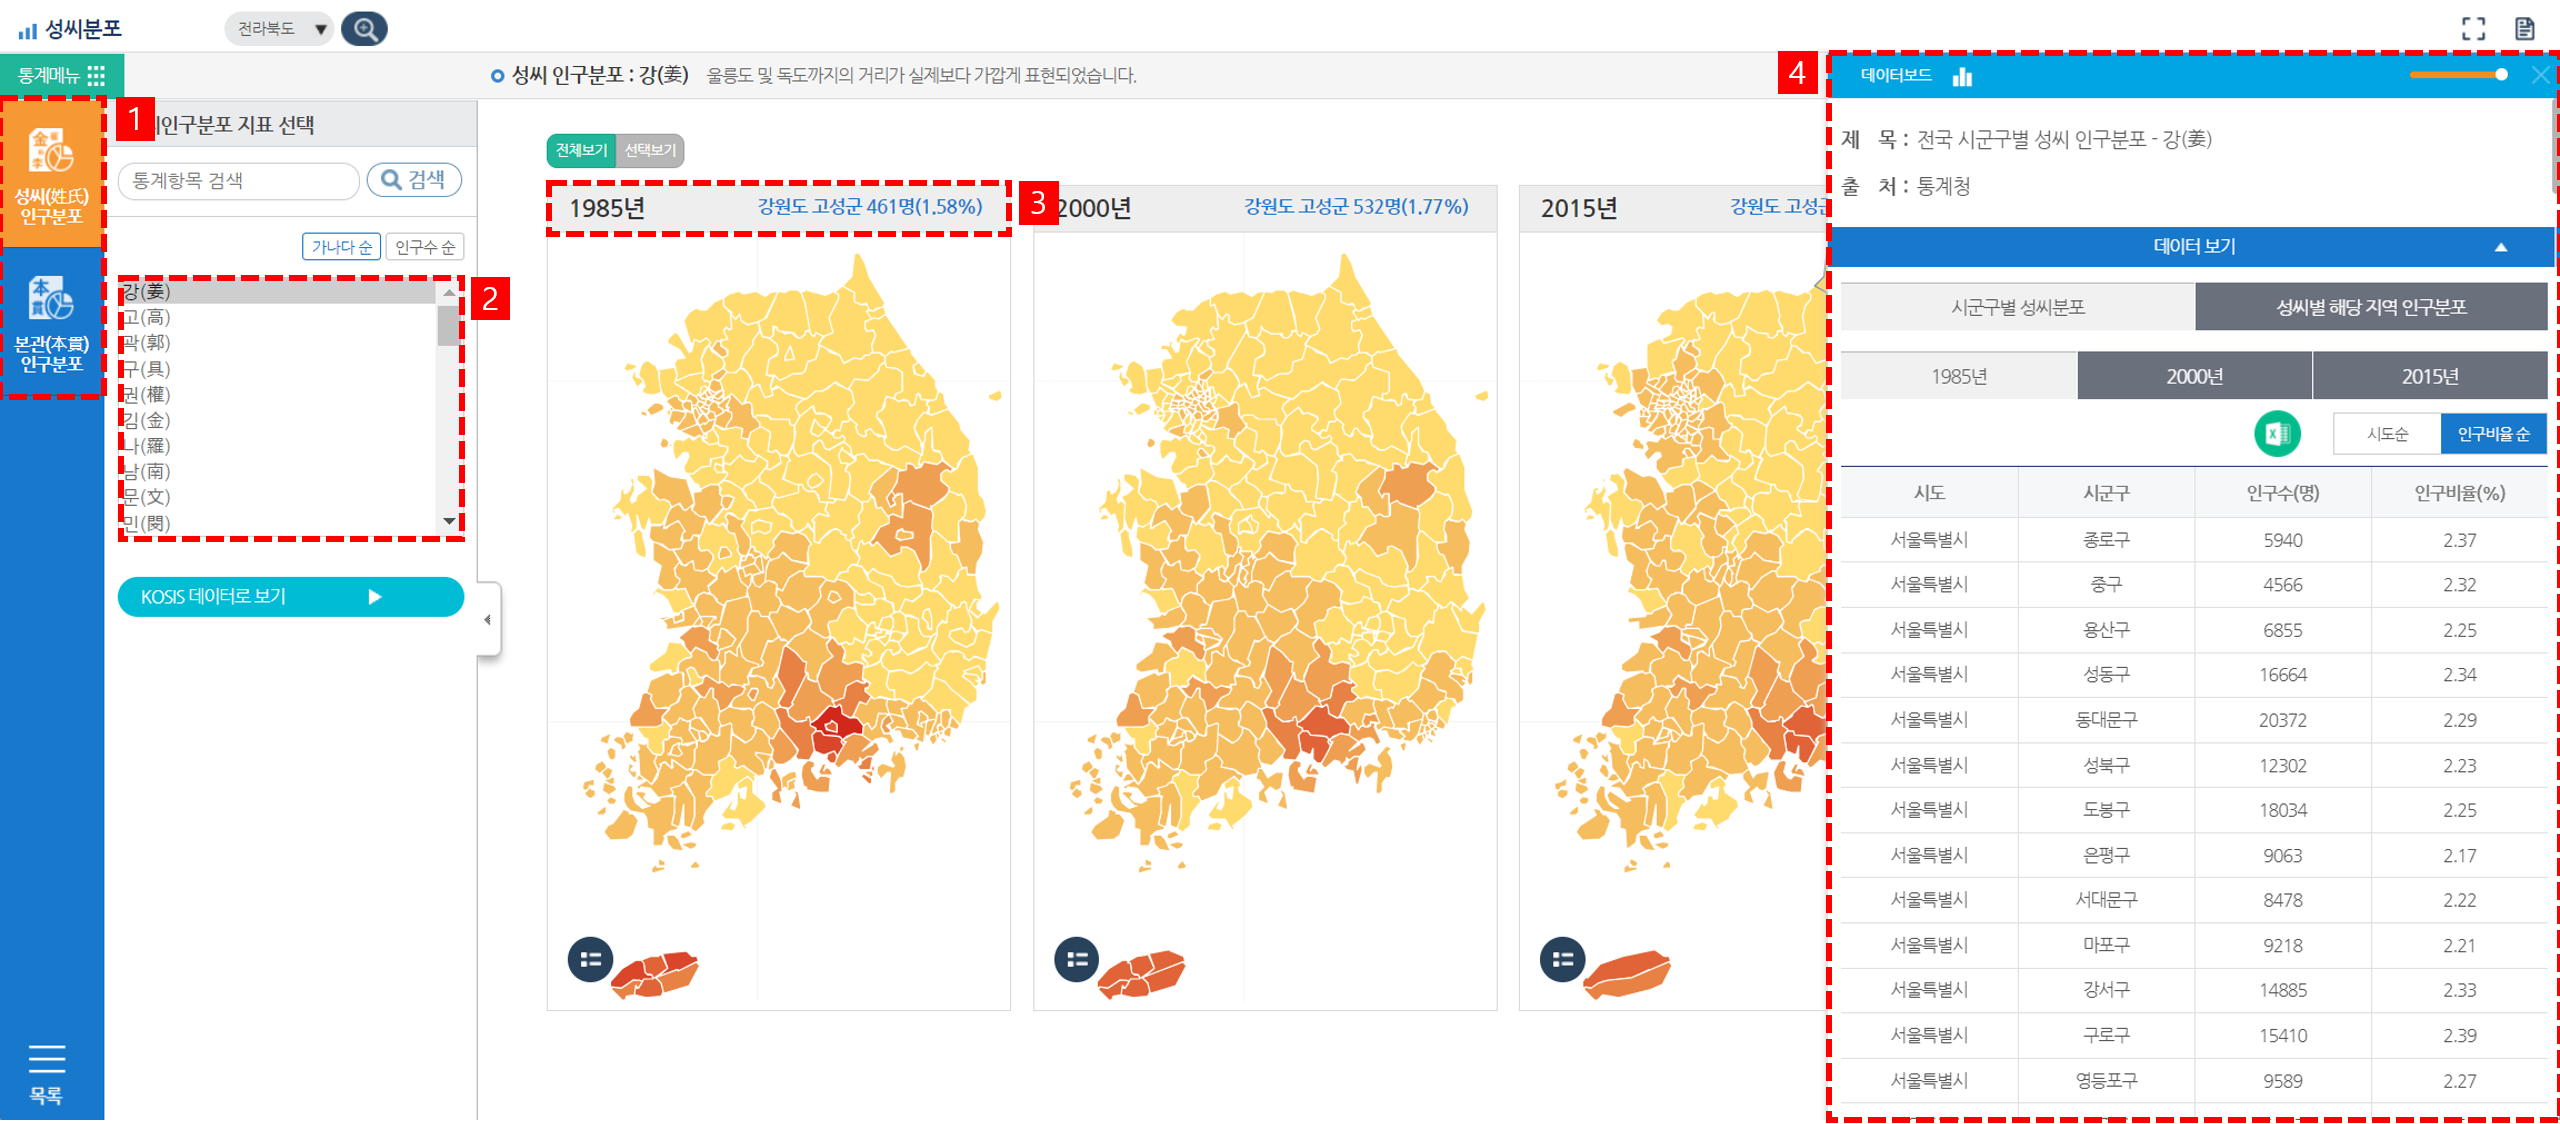
1) Select Surname and Ancestral Origin Population Distribution: Choose population distribution by surname or ancestral origin.
2) Select the Surname: Choose a surname to retrieve population distribution.
3) Display statistical value: Population distribution status is displayed according to the selected condition.
4) View data: You can inquire data about selected population information.
Regional Trend View
Service Overview
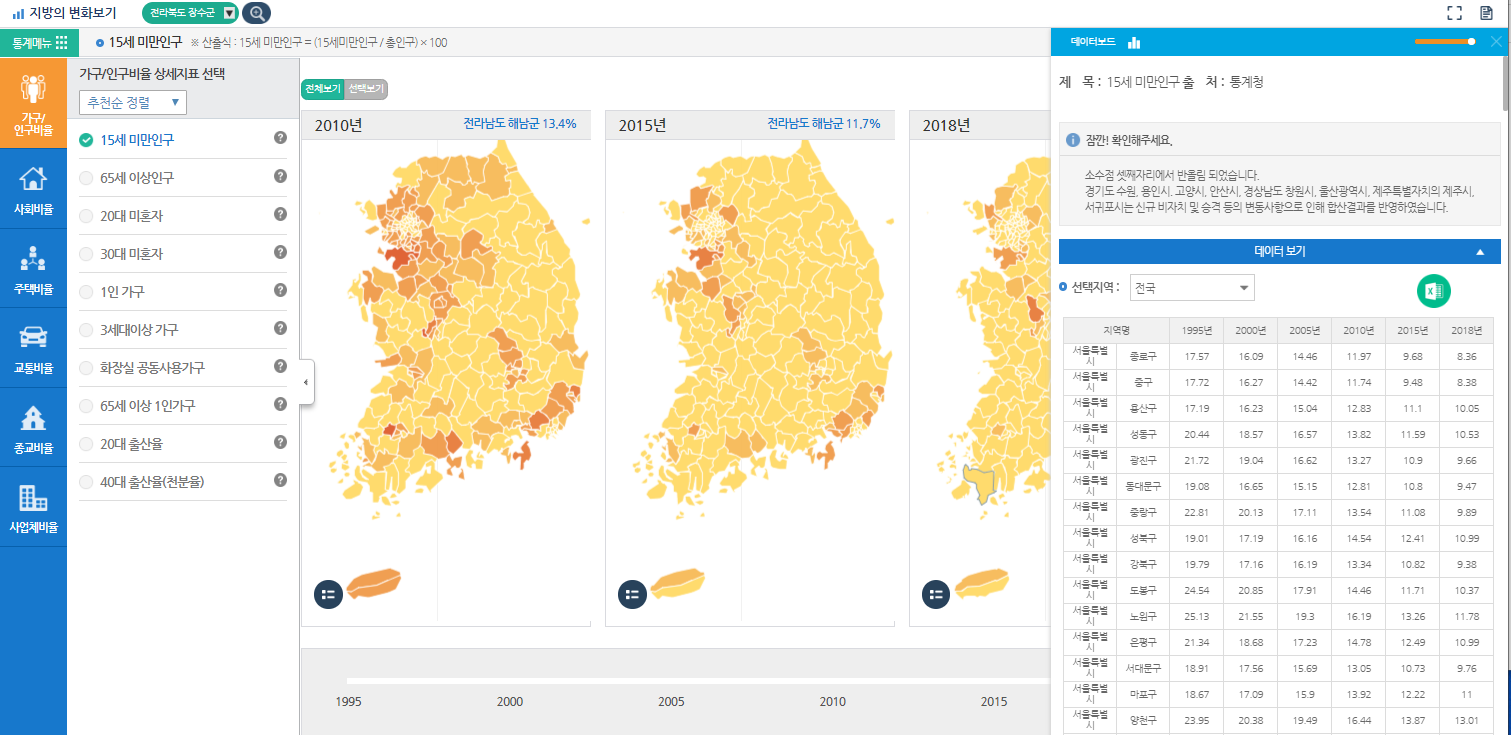
○ 'Regional Trend View' is a service that statistically provides the changing trends in regions (Si, Gun, & Gu).
○ From 1995 to the present, statistical information on the population, housing ratios, etc. for Si, Gun, & Gu levels is provided on maps at 5-year intervals. Three maps are displayed simultaneously to allow for a quick assessment of statistical changes.
○ Statistical information can be checked in tabular form in addition to the map, and statistics for the whole year are provided in units at the provincial level.
○ The statistical items provided are as follows.
- Households / Population Ratio: Population by age group / marital status, households with one or more households, birth rate of 20s / 40s, etc.
- Ratio of Social: education level, female education, remarriage ratio, etc.
- Ratio of Traffic: commuting population, commuting transportation, automobiles, etc.
- Ratio of Housing: Ratio of apartments/condominiums/detached houses, housing ratios by area, etc.
- Ratio of Religious: Population of Buddhism/Catholicism/Protestantism/other religious population.
- Ratio of Establishment: Ratio of PC rooms/convenience stores/daycare centers/academies.
Screen Layout
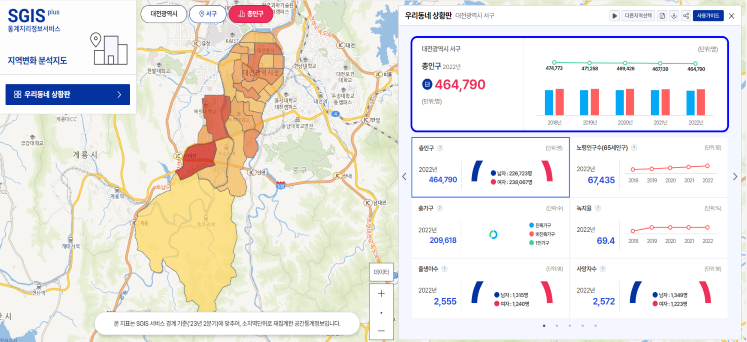
Neighborhood Trend Analysis Map
Service Overview
○ 'Neighborhood Trend Analysis Map’ is a service that intuitively displays various statistical information and statistical geographic information in KOSIS and SGIS contents of Si, Gun & Gu that a user selects.
○ Through [My neighborhood bulletin board], users can find various statistical information of Si, Gun & Gu to which they access, in the format of bulletin board without further operation.
○ In addition, in [View recommended indicators] and [View all indicators], users can conveniently check indicators of the selected Si, Gun & Gu after selecting a region for each content.
○ Major functions
| My neighborhood bulletin board | View recommended indicators | View all indicators |
|---|---|---|
| Providing various statistical information and statistical geographic information of the selected Si, Gun & Gu in the format of bulletin board |
Providing various statistical geographic information of SGIS contents of the selected Si, Gun & Gu in a convenient way |
|
| Providing various functions such as time-series data graphs or maps, ranking of the region, comparison with other Si, Gun & Gu regions, and viewing small area data |
Providing brief information on an indicator and a direct link to SGIS contents of the corresponding indicator |
|
Screen Layout