Report
Users can print their desired report after clicking the 'Setting' button.
 Statistical Geographic Information Service (https://sgis.kostat.go.kr)
Analysis report on 'The neighborhood where I want to live'
Date : 2023년 07월 25일 15시 36분- The nation
- Region where you want to live
- 경기도 고양시 일산 동구 장항2동
Selected indicator
-
공동주택비율
- Judgement standardHigh
- Importance상
-
편의시설 수
- Judgement standardHigh
- Importance상
-
청장년 인구 비율
- Judgement standardHigh
- Importance상
-
학원 수
- Judgement standardHigh
- Importance상
-
체육시설 수
- Judgement standardHigh
- Importance상
-
문화시설 수
- Judgement standardHigh
- Importance상
Comprehensive status of the region
- Recommended regions :
- 경기도 고양시 일산동구 장항2동 평균
- Comparison regions :
- 전국 평균
| Indicators | Comparison regions (The nation) |
Region where I want to live (전라북도 전주시 덕진구 호성동) |
|---|
- Recommended regions :
- 경기도 고양시 일산동구 장항2동 평균
- Comparison regions :
- 전국 평균
| Indicators | Comparison regions (The nation) |
Region where I want to live (전라북도 전주시 덕진구 호성동) |
|---|
- Recommended regions :
- 경기도 고양시 일산동구 장항2동 평균
- Comparison regions :
- 전국 평균
| Indicators | Comparison regions (The nation) |
Region where I want to live (전라북도 전주시 덕진구 호성동) |
|---|
Information on the population, housing and establishments – Population by age group
| Age | Comparison regions(Province) (전주시 덕진구) |
Comparison regions(Si, Gun & Gu) (전주시 덕진구) |
Region where I want to live (호성동) |
|---|---|---|---|
| 10세 이하 | 8.85 | 6948 | |
| 10대 | 8.85 | 6948 | |
| 20대 | 8.85 | 6948 | |
| 30대 | 8.85 | 6948 | |
| 40대 | 8.85 | 6948 | |
| 50대 | 8.85 | 6948 | |
| 60대 | 8.85 | 6948 | |
| 70세 이상 | 8.85 | 6948 |
Information on the population, housing and establishments – Housing type
| Age | Comparison regions(Province) (전주시 덕진구) |
Comparison regions(Si, Gun & Gu) (전주시 덕진구) |
Region where I want to live (호성동) |
|---|
Information on the population, housing and establishments – Number of establishments
| Age | Comparison regions(Province) (전주시 덕진구) |
Comparison regions(Si, Gun & Gu) (전주시 덕진구) |
Region where I want to live (호성동) |
|---|
Indicator status
Map visualization
Memo
Report settings
Select comparison regions
Select indicators
Select Information on the population, housing and establishments
Service guide
A statistics-based housing recommendation service
The neighborhood where I want to live'My neighborhood where I want to live' is a statistics-based service that recommend residential areas, which meet users' conditions. Users can check a list of recommended regions and statistical information that meet their conditions among a total of 51 kinds of indicators of 7 categories such as nature, housing, population, safety, social infrastructure (including transportation), education, and welfare & culture.
Major functions
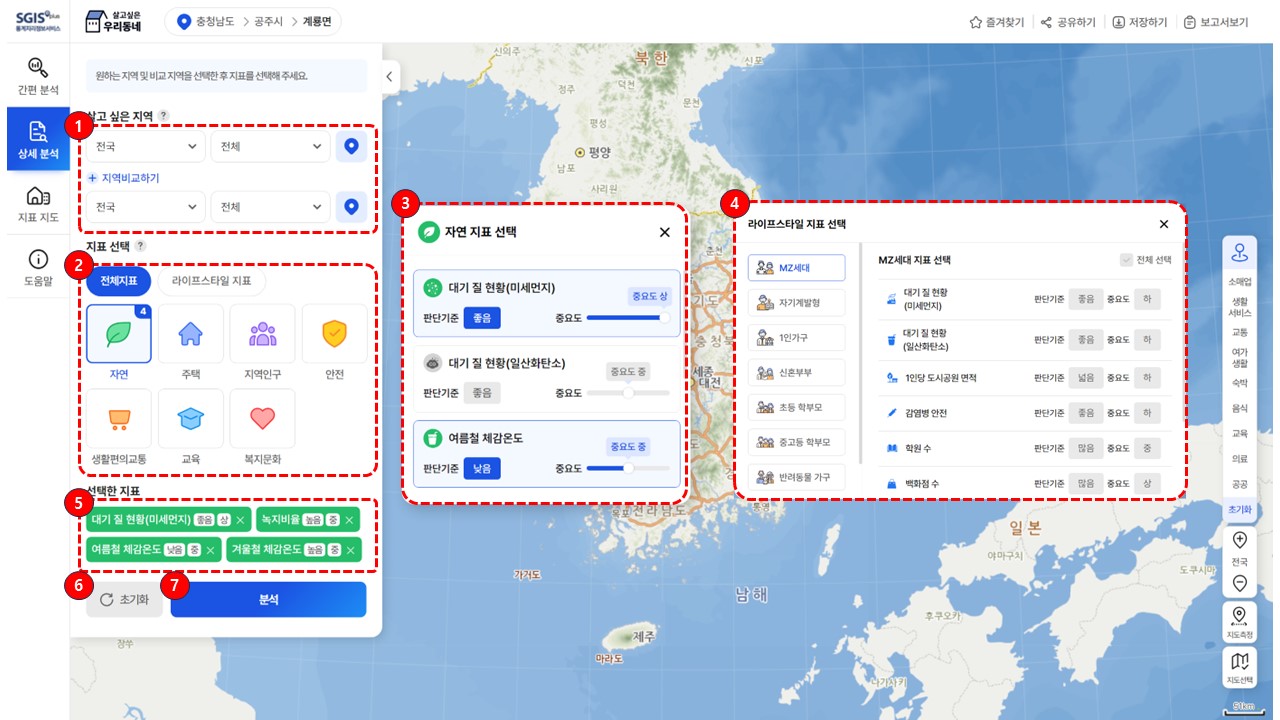
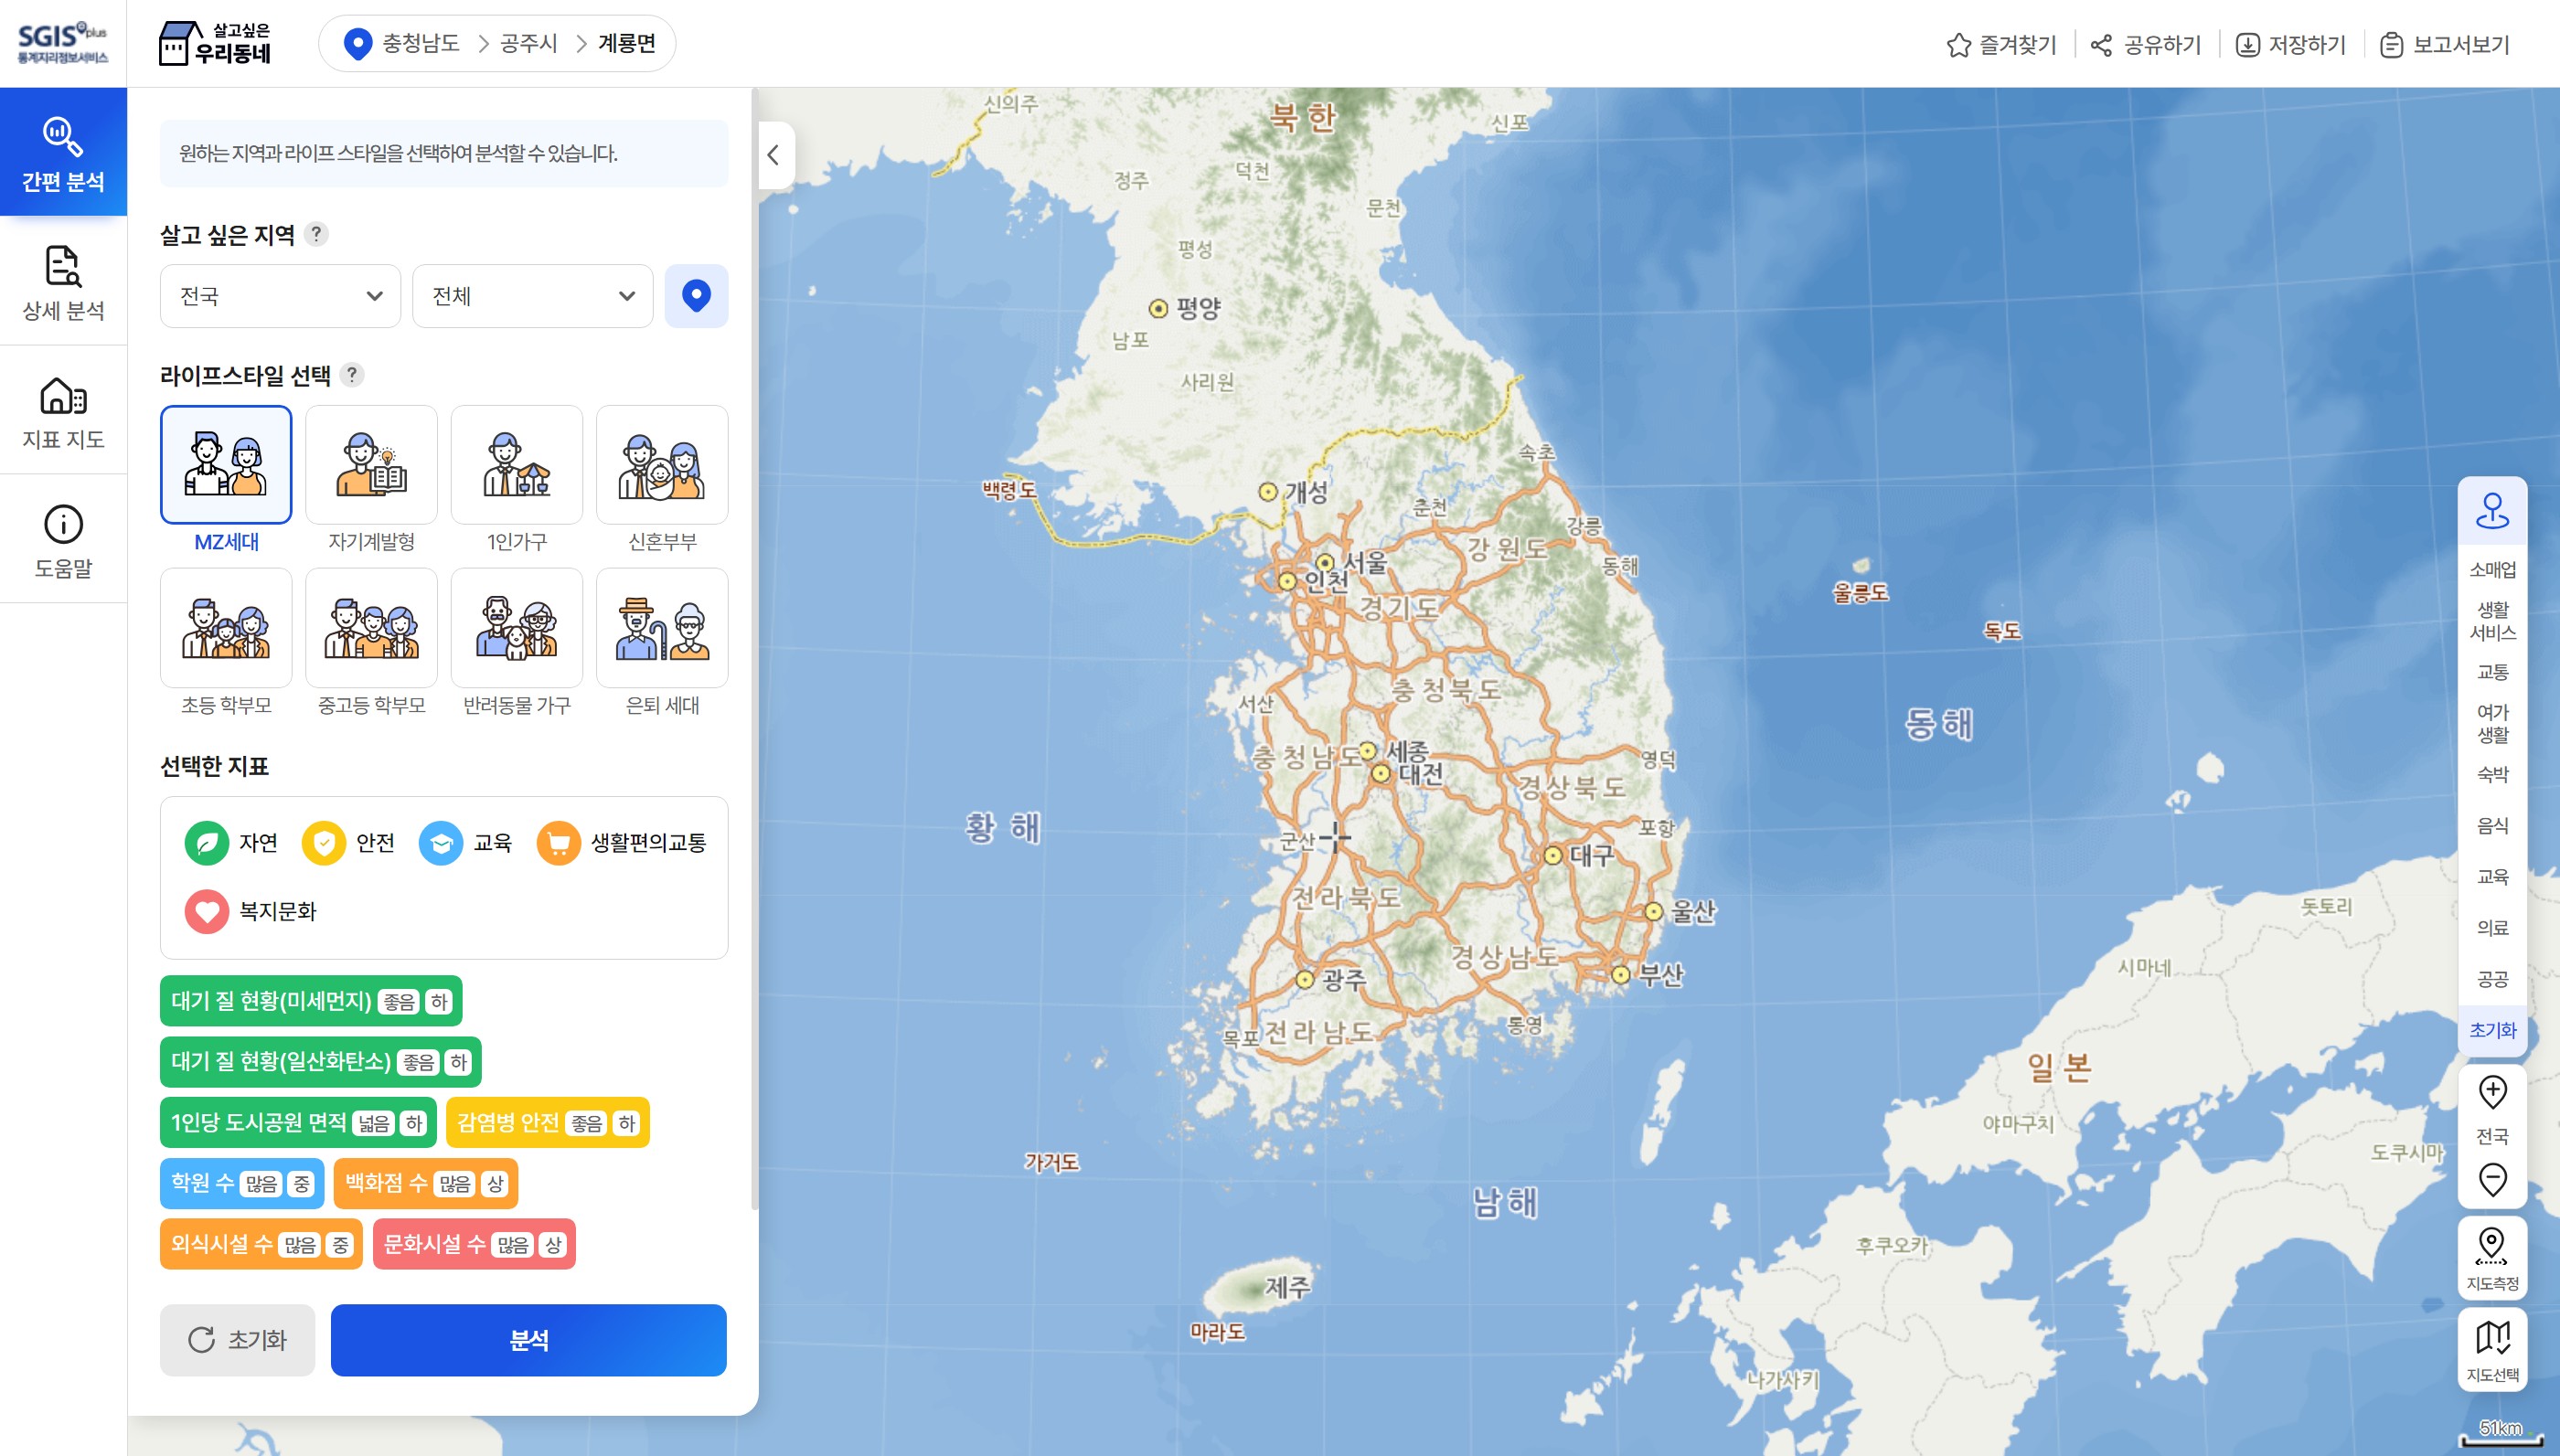
- Brief analysis
- A service that recommends a residential area after analyzing indicators according to users' lifestyle. This service has detailed functions such as recommending a region where users want to live, finding indicators automatically according to their lifestyle and viewing a list of recommended regions.
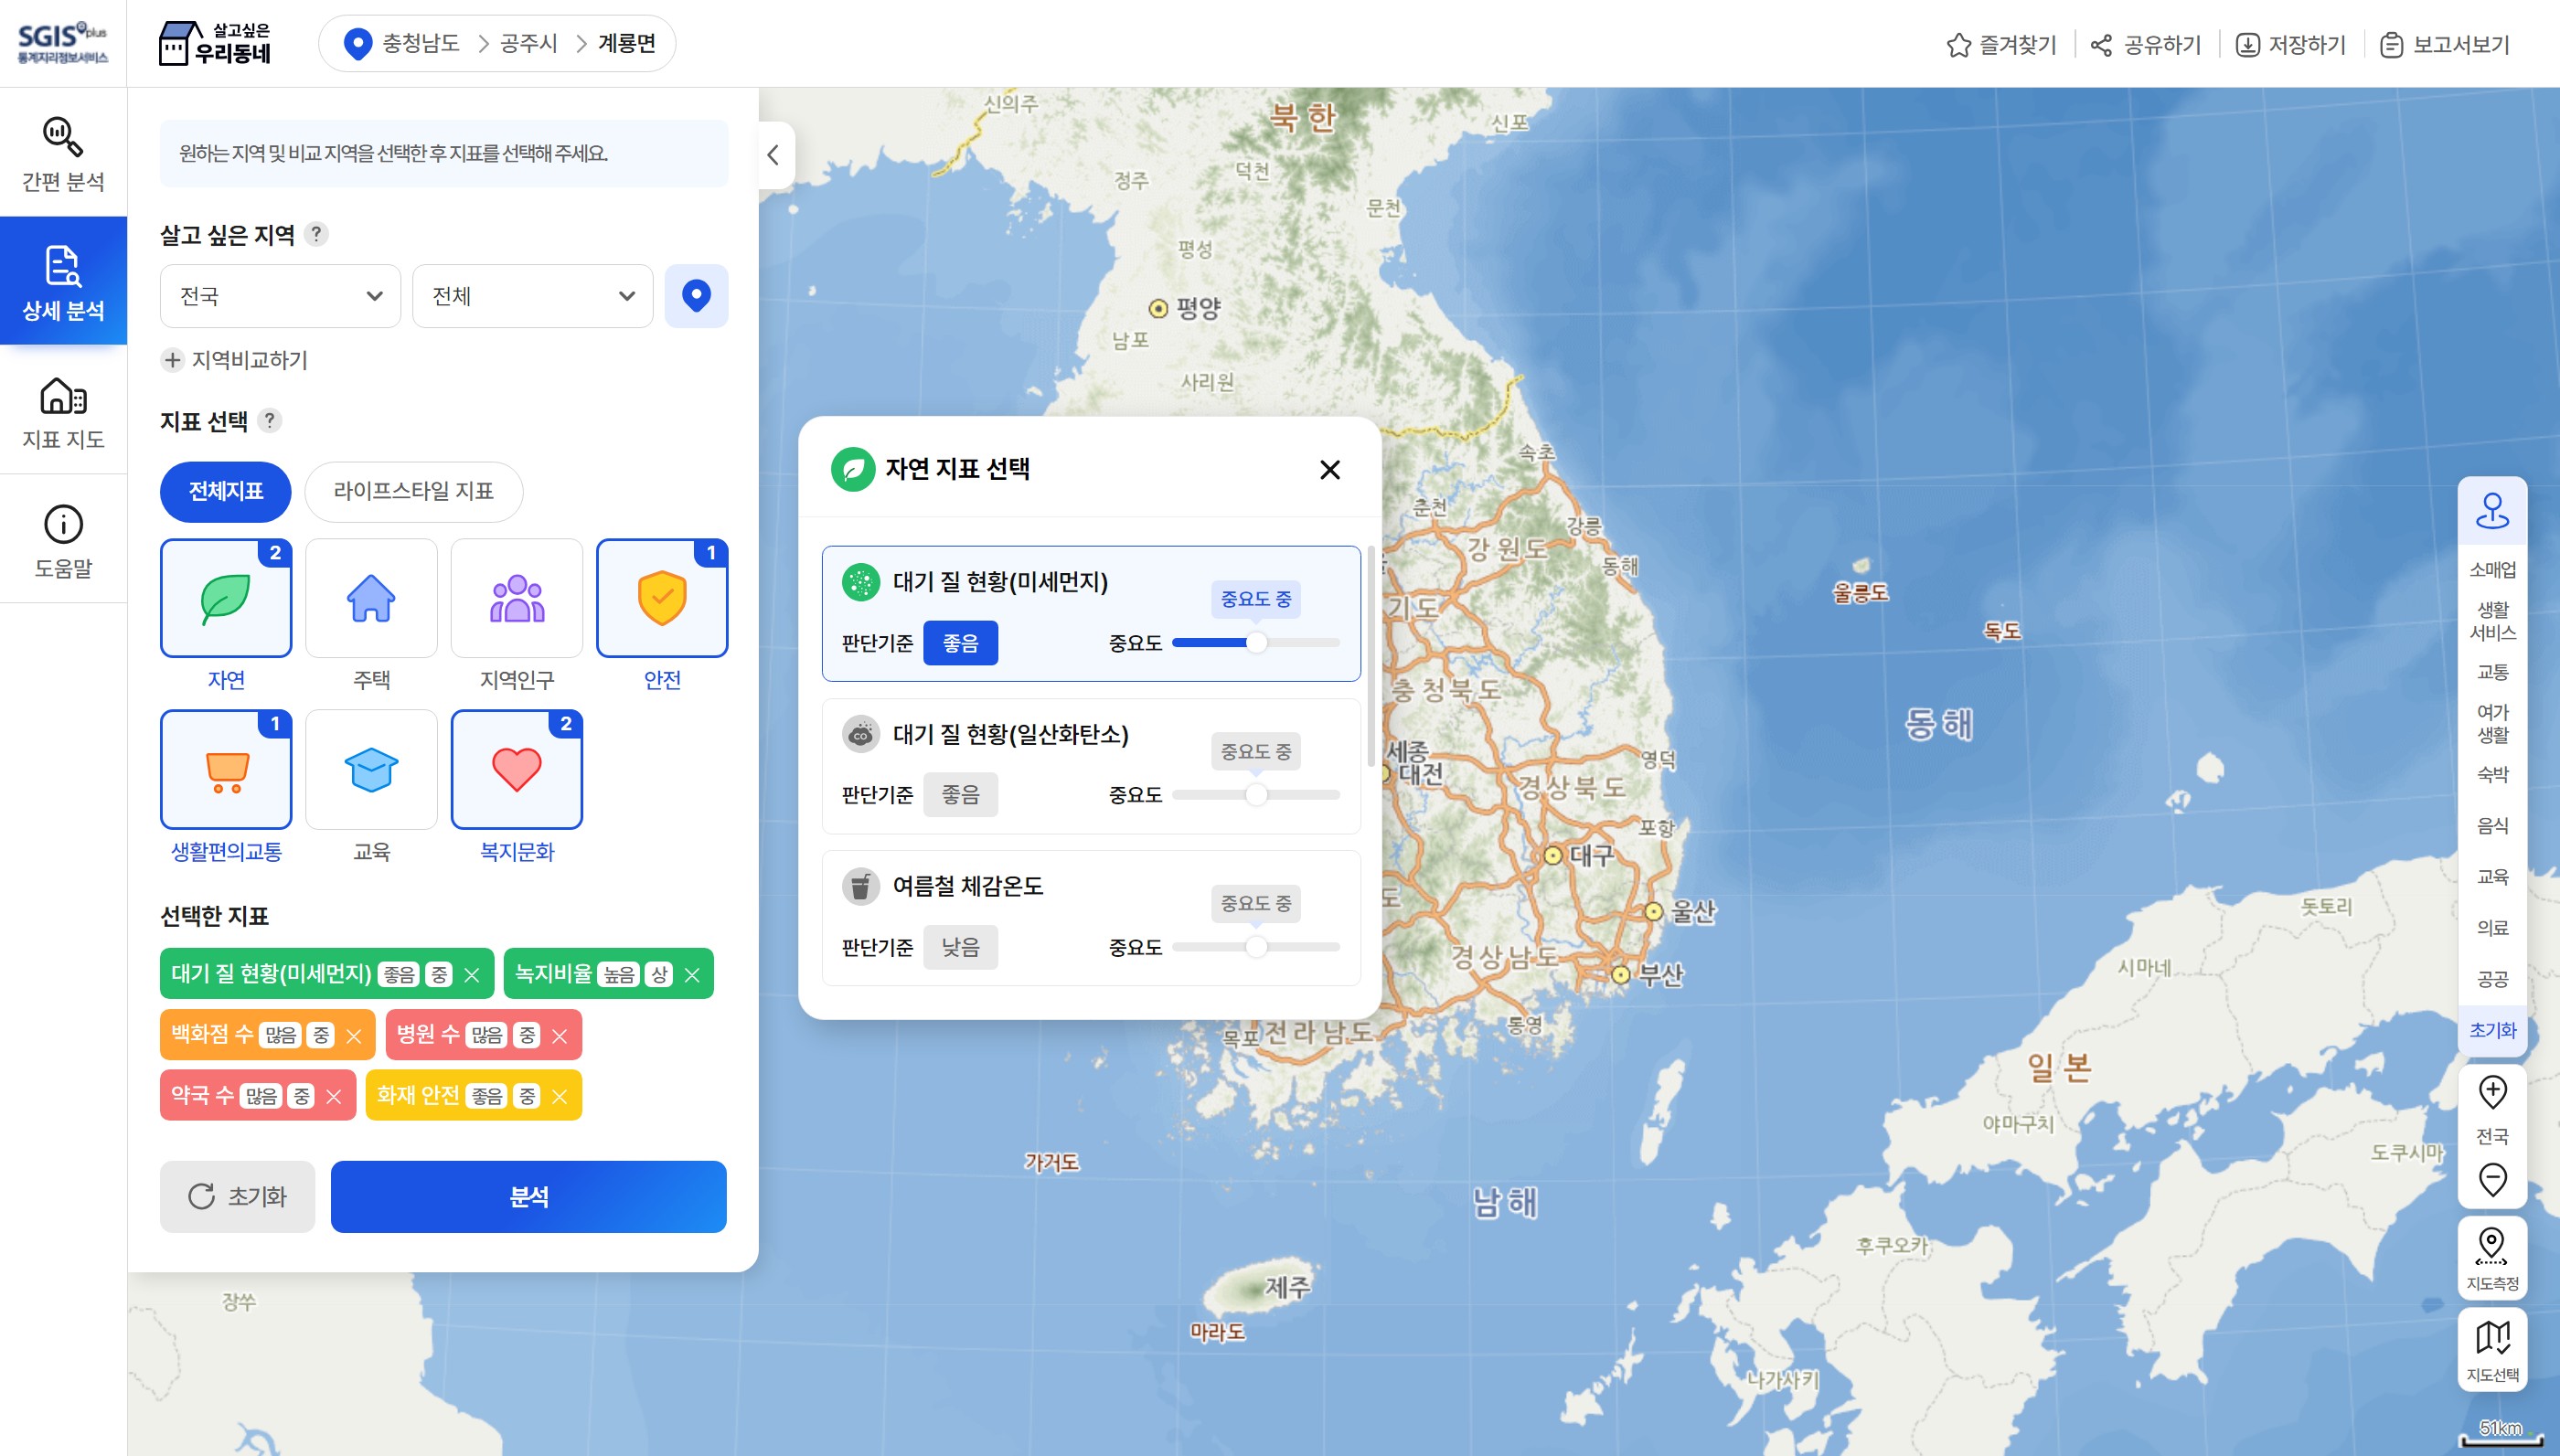
- Detailed analysis
- A service that recommends a residential area after analyzing selected indicators. This service has detailed functions such as recommending a region where users want to live, providing indicators according to their lifestyle, setting judgement standard and importance, and viewing a list of recommended regions.
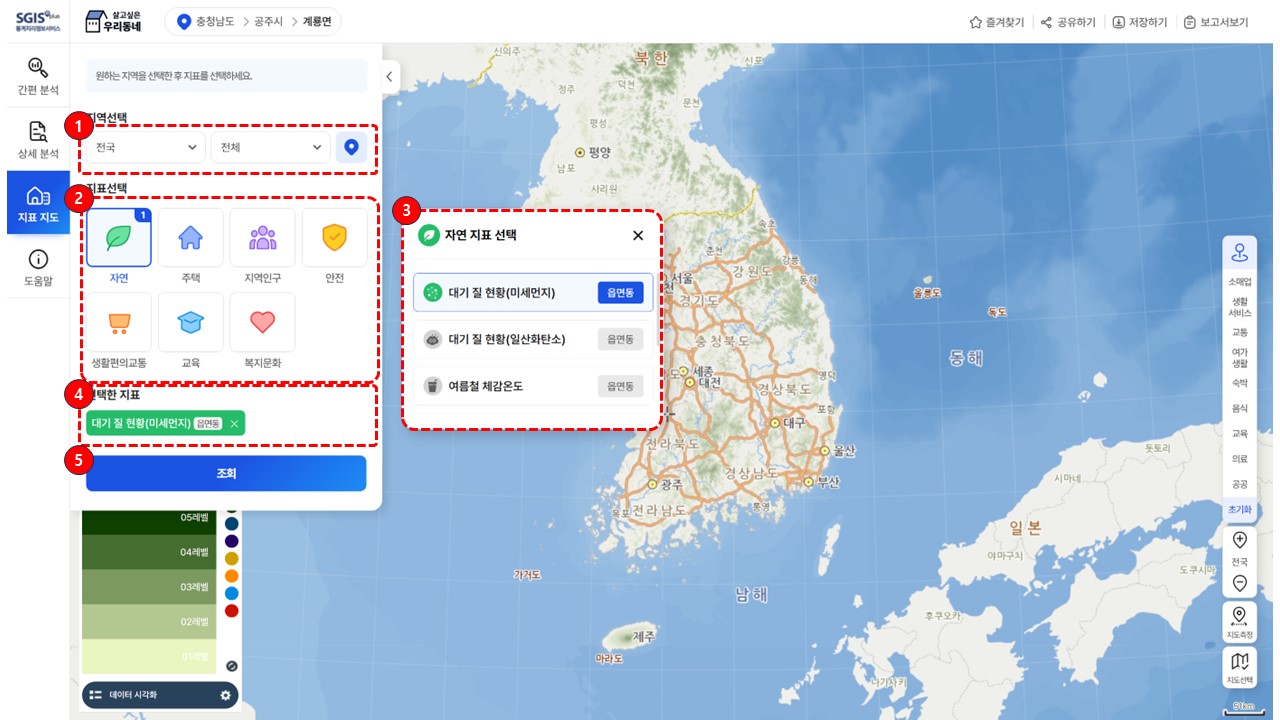
- Indicator map
- Users can check the status by region of the selected indicator and information on the population, housing and establishments.
 Brief analysis
 Detailed analysis
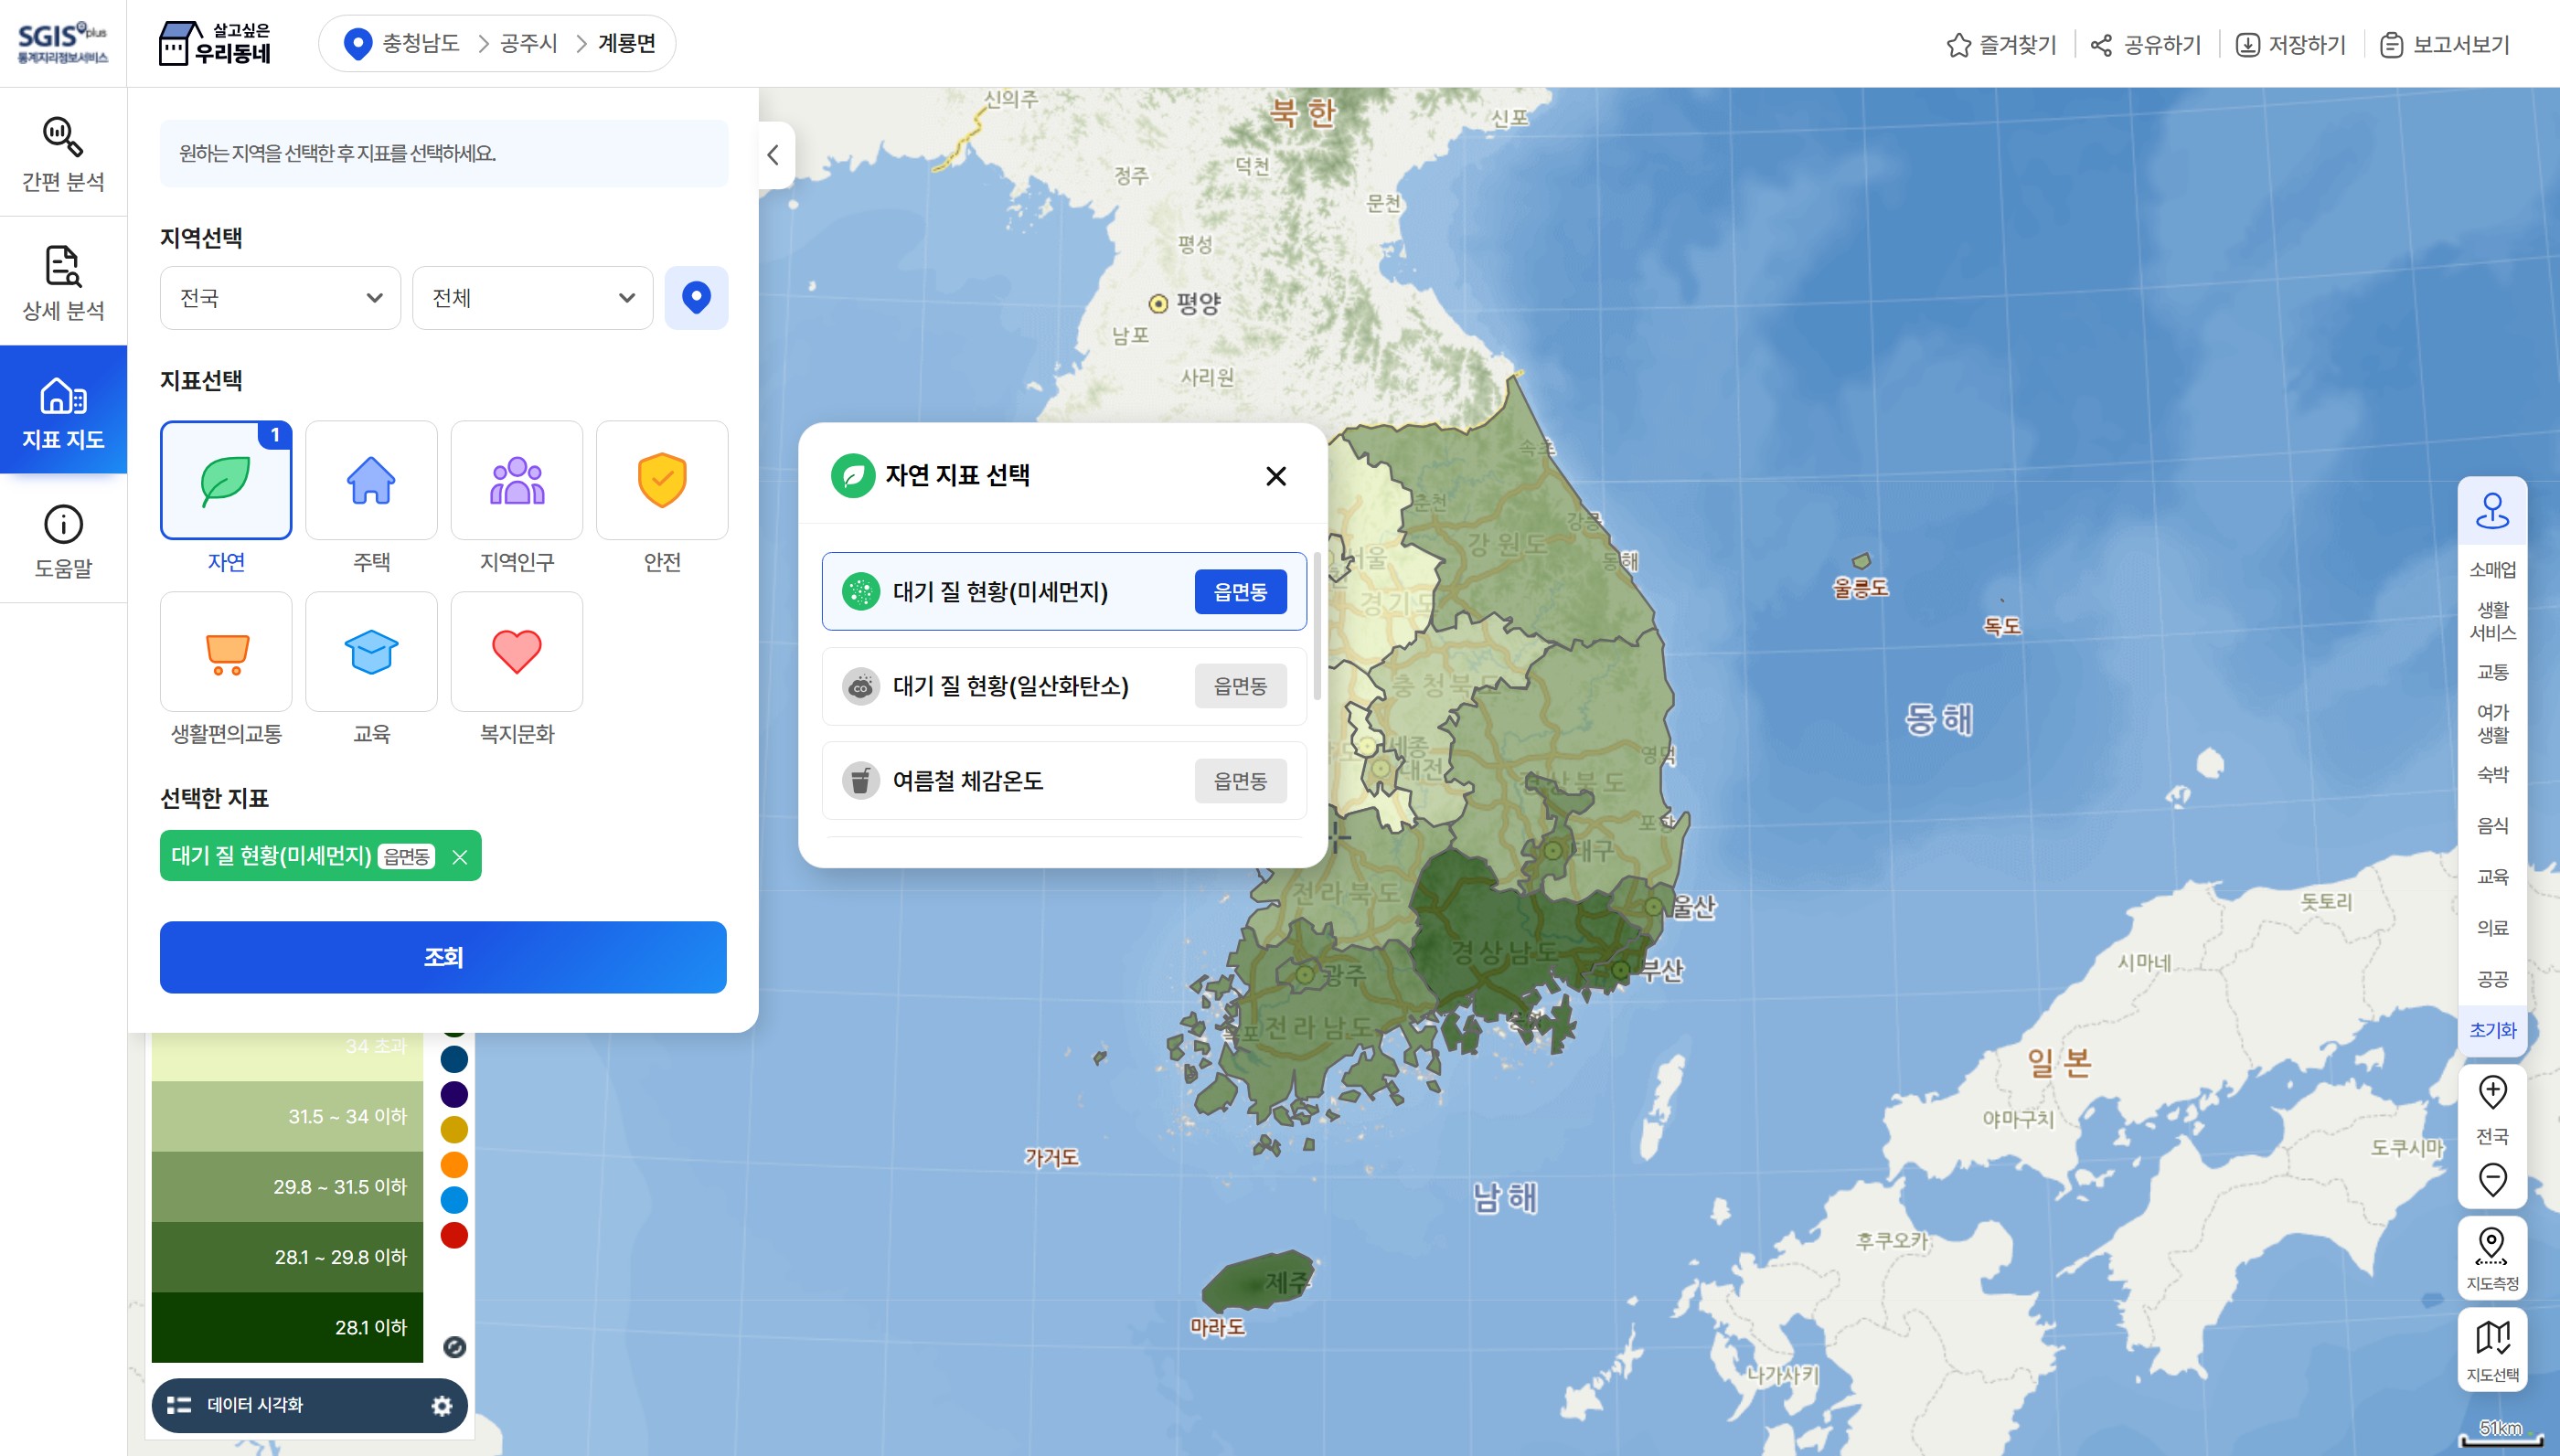 Indicator map
Major indicators
- Nature
- Air quality status (fine dust) , Air quality status (Carbon monoxide) , Perceived temperature in summer , Perceived temperature in winter , Percentage of green space , Urban park area per person
- Housing
- Share of apartments , Share of row houses and apartment units in a private house , Share of detached houses , Residential area , Share of old housing units , Share of owner-occupied housing units , Officially assessed land price , Apartment price per area
- Population indicators
- Share of the young population , Share of the youth and middle-aged population , Share of the elderly population , Share of one-person households , Share of workers of establishments , Net migration rate
- Safety
- Fire safety , Traffic accident safety , Crime safety , Life safety , Infectious disease safety , CCTV distribution status
- Social infrastructure
- Number of convenience stores , Number of department stores , Number of large discount stores , Number of supermarkets and convenience stores , Number of grocery stores , Number of restaurants , Number of public transportation facilities , Number of pet-related service establishments
- Education
- Number of elementary school students per class , Number of middle school students per class , Number of high school students per class , Number of elementary schools , Number of middle schools , Number of high schools , Number of private academic institutes
- Welfare and culture
- Number of kindergartens and childcare facilities , Number of hospitals , Number of clinics , Number of pharmacies , Number of veterinary hospitals , Number of welfare facilities for the elderly , Number of social welfare facilities , Number of welfare facilities for the disabled , Number of cultural facilities , Number of sports facilities
Indicator description
| Indicator title | Unit | Indicator contents | Data level | Dataset time point |
|---|---|---|---|---|
| Air quality status (fine dust) | ㎍/㎥ | Average concentration of fine dust | Eup, Myeon & Dong | 2022 |
| Air quality status (Carbon monoxide) | ppm | Average concentration of carbon monoxide (CO) | Eup, Myeon & Dong | 2022 |
| Perceived temperature in summer | ℃ | Perceived temperature in summer (May ~ September) | Eup, Myeon & Dong | 2024 |
| Perceived temperature in winter | ℃ | Perceived temperature in winter (October ~ April) | Eup, Myeon & Dong | 2023 |
| Percentage of green space | % | Percentage of green space (forest, grassland) on land cover map by administrative district | Eup, Myeon & Dong | 2023 |
| Urban park area per person | ㎡ | Urban park area per person by administrative district | Eup, Myeon & Dong | 2023 |
| Indicator title | Unit | Indicator contents | Data level | Dataset time point |
|---|---|---|---|---|
| Share of apartments | % | Share of apartments (% the total housing units) | Eup, Myeon & Dong | 2023 |
| Share of row houses and apartment units in a private house | % | hare of row houses and apartment units in a private house (% the total housing units) | Eup, Myeon & Dong | 2023 |
| Share of detached houses | % | Share of detached houses (% the total housing units) | Eup, Myeon & Dong | 2023 |
| Residential area | ㎡ | Residential floor area per person | Eup, Myeon & Dong | 2023 |
| Share of old housing units | % | Share of housing units built 30 years ago or more (before 2001) | Eup, Myeon & Dong | 2023 |
| Share of owner-occupied housing units | % | Share of owner-occupied housing units | Si, Gun & Gu | 2020 |
| Officially assessed land price | 원 | Price of residential land per unit area (1㎡) | Eup, Myeon & Dong | 2023 |
| Apartment price per area | 원 | Actual transaction price of apartments per area (1㎡) | Eup, Myeon & Dong | 2023 |
| Indicator title | Unit | Indicator contents | Data level | Dataset time point |
|---|---|---|---|---|
| Share of the young population | % | Share of the young population aged 14 or less (% of the total population) | Eup, Myeon & Dong | 2023 |
| Share of the youth and middle-aged population | % | Share of the working age population aged 15 ~ 64 (% of the total population) | Eup, Myeon & Dong | 2023 |
| Share of the elderly population | % | Share of the elderly population aged 65 or more (% of the total population) | Eup, Myeon & Dong | 2023 |
| Share of one-person households | % | Share of one-person households (% of the total households) | Eup, Myeon & Dong | 2023 |
| Share of workers of establishments | % | Share of workers of establishments (% of the population of the region) | Eup, Myeon & Dong | 2023 |
| Net migration rate | % | Net migration rate (In-migration - Out-migration) by Si, Gun & Gu | Si, Gun & Gu | 2023 |
| Indicator title | Unit | Indicator contents | Data level | Dataset time point |
|---|---|---|---|---|
| Fire safety | grade | Fire-related safety grade (Grade 1~5) | Si, Gun & Gu | 2023 |
| Traffic accident safety | grade | Traffic accident-related safety grade (Grade 1~5) | Si, Gun & Gu | 2023 |
| Crime safety | grade | Five major crime-related safety grade (Grade 1~5) | Si, Gun & Gu | 2023 |
| Life safety | grade | Life-related safety grade (Grade 1~5) | Si, Gun & Gu | 2023 |
| Infectious disease safety | grade | Statutory infectious disease-related safety grade (Grade 1~5) | Si, Gun & Gu | 2023 |
| CCTV distribution status | each | CCTV distribution status by administrative district | Eup, Myeon & Dong | 2023 |
| Indicator title | Unit | Indicator contents | Data level | Dataset time point |
|---|---|---|---|---|
| Number of convenience stores | each | Number of public agencies (central and local government agency, community center, police station, post office, etc.), banks and parking lots | Eup, Myeon & Dong | 2022 |
| Number of department stores | each | Number of department stores | Si, Gun & Gu | 2022 |
| Number of large discount stores | each | Number of non-specialized superstores (with sales space of at least three thousand square meters) | Eup, Myeon & Dong | 2022 |
| Number of supermarkets and convenience stores | each | Number of supermarkets and convenience stores | Eup, Myeon & Dong | 2022 |
| Number of grocery stores | each | Number of grocery stores | Eup, Myeon & Dong | 2022 |
| Number of restaurants | each | Number of Restaurants | Eup, Myeon & Dong | 2022 |
| Number of public transportation facilities | each | Number of bus stops and metro stations | Eup, Myeon & Dong | 2024 |
| Number of pet-related service establishments | each | Number of pet-related service establishments | Eup, Myeon & Dong | 2022 |
| Indicator title | Unit | Indicator contents | Data level | Dataset time point |
|---|---|---|---|---|
| Number of elementary school students per class | person | Number of elementary school students per class by administrative district (by school level) | Eup, Myeon & Dong | 2023 |
| Number of middle school students per class | person | Number of middle school students per class by administrative district (by school level) | Eup, Myeon & Dong | 2023 |
| Number of high school students per class | person | Number of high school students per class by administrative district (by school level) | Eup, Myeon & Dong | 2023 |
| Number of elementary schools | each | Number of elementary schools | Eup, Myeon & Dong | 2023 |
| Number of middle schools | each | Number of middle schools | Eup, Myeon & Dong | 2023 |
| Number of high schools | each | Number of high schools | Eup, Myeon & Dong | 2023 |
| Number of private academic institutes | each | Number of private academic institutes | Eup, Myeon & Dong | 2022 |
| Indicator title | Unit | Indicator contents | Data level | Dataset time point |
|---|---|---|---|---|
| Number of kindergartens and childcare facilities | each | Number of kindergartens and childcare facilities by administrative district | Eup, Myeon & Dong | 2022 |
| Number of hospitals | each | Number of general hospitals and hospitals by administrative district | Si, Gun & Gu | 2022 |
| Number of clinics | each | Number of clinics by administrative district | Eup, Myeon & Dong | 2022 |
| Number of pharmacies | each | Number of pharmacies by administrative district | Eup, Myeon & Dong | 2022 |
| Number of veterinary hospitals | each | Number of veterinary hospitals by administrative district | Eup, Myeon & Dong | 2022 |
| Number of welfare facilities for the elderly | each | Number of welfare facilities for the elderly by administrative district | Eup, Myeon & Dong | 2022 |
| Number of social welfare facilities | each | Number of social welfare facilities by administrative district | Eup, Myeon & Dong | 2022 |
| Number of welfare facilities for the disabled | each | Number of welfare facilities for the disabled by administrative district | Eup, Myeon & Dong | 2022 |
| Number of cultural facilities | each | Number of cultural facilities by administrative district (theater, cinema, museum, historic site, botanical garden, zoo, park, amusement park) | Eup, Myeon & Dong | 2022 |
| Number of sports facilities | each | Number of sports facilities by administrative district (sports park, health club, swimming pool, etc.) | Eup, Myeon & Dong | 2022 |
User guide for brief analysis
A statistics-based housing recommendation service
A service that recommends a residential area after analyzing indicators according to users' lifestyle. This service has detailed functions such as recommending a region where users want to live, finding indicators automatically according to their lifestyle and viewing a list of recommended regions.
User guide for detailed analysis
A statistics-based housing recommendation service
A service that recommends a residential area after analyzing selected indicators. This service has detailed functions such as recommending a region where users want to live, providing indicators according to their lifestyle, setting judgement standard and importance, and viewing a list of recommended regions.
User guide for indicator map
A statistics-based housing recommendation service
Users can check the status by region of the selected indicator and information on the population, housing and establishments.
Notice
Notice
Do you want to move to another menu?
Notice
Notice
When clicking the 'Stay' button and moving to administrative district level, users can see POI data again.
즐겨찾기
즐겨찾기 하시겠습니까?
Notices
Through 'Detailed analysis', you can utilize or change indicators based on your lifestyle choice.
Save this webpage as an image
Lifestyle-based indicator selection
-
Air quality status (fine dust)
- Judgement standardGood
- ImportanceLow
-
Air quality status (Carbon monoxide)
- Judgement standardGood
- ImportanceLow
-
Urban park area per person
- Judgement standardWide
- ImportanceLow
-
Infectious disease safety
- Judgement standardGood
- ImportanceLow
-
Number of private academic institutes
- Judgement standardMany
- ImportanceMedium
-
Number of department stores
- Judgement standardMany
- ImportanceHigh
-
Number of restaurants
- Judgement standardMany
- ImportanceMedium
-
Number of cultural facilities
- Judgement standardMany
- ImportanceHigh
-
Number of sports facilities
- Judgement standardMany
- ImportanceHigh
-
Urban park area per person
- Judgement standardWide
- ImportanceMedium
-
Number of department stores
- Judgement standardMany
- ImportanceMedium
-
Number of large discount stores
- Judgement standardMany
- ImportanceMedium
-
Number of public transportation facilities
- Judgement standardMany
- ImportanceLow
-
Number of private academic institutes
- Judgement standardMany
- ImportanceMedium
-
Number of cultural facilities
- Judgement standardMany
- ImportanceHigh
-
Number of sports facilities
- Judgement standardMany
- ImportanceHigh
-
Apartment price per area
- Judgement standardLow
- ImportanceLow
-
Share of the youth and middle-aged population
- Judgement standardHigh
- ImportanceHigh
-
Crime safety
- Judgement standardGood
- ImportanceMedium
-
Number of department stores
- Judgement standardMany
- ImportanceMedium
-
Number of supermarkets and convenience stores
- Judgement standardMany
- ImportanceHigh
-
Number of public transportation facilities
- Judgement standardMany
- ImportanceMedium
-
Number of cultural facilities
- Judgement standardMany
- ImportanceHigh
-
Urban park area per person
- Judgement standardWide
- ImportanceLow
-
Share of apartments
- Judgement standardHigh
- ImportanceHigh
-
Residential area
- Judgement standardWide
- ImportanceLow
-
Apartment price per area
- Judgement standardLow
- ImportanceMedium
-
Number of convenience stores
- Judgement standardMany
- ImportanceMedium
-
Number of large discount stores
- Judgement standardMany
- ImportanceMedium
-
Number of kindergartens and childcare facilities
- Judgement standardMany
- ImportanceHigh
-
Number of clinics
- Judgement standardMany
- ImportanceHigh
-
Share of apartments
- Judgement standardHigh
- ImportanceHigh
-
Residential area
- Judgement standardWide
- ImportanceMedium
-
Crime safety
- Judgement standardGood
- ImportanceLow
-
Number of large discount stores
- Judgement standardMany
- ImportanceLow
-
Number of supermarkets and convenience stores
- Judgement standardMany
- ImportanceLow
-
Number of restaurants
- Judgement standardMany
- ImportanceMedium
-
Number of public transportation facilities
- Judgement standardMany
- ImportanceMedium
-
Number of elementary schools
- Judgement standardMany
- ImportanceHigh
-
Number of private academic institutes
- Judgement standardMany
- ImportanceHigh
-
Number of clinics
- Judgement standardMany
- ImportanceMedium
-
Share of apartments
- Judgement standardHigh
- ImportanceHigh
-
Residential area
- Judgement standardWide
- ImportanceMedium
-
Apartment price per area
- Judgement standardHigh
- ImportanceMedium
-
Crime safety
- Judgement standardGood
- ImportanceLow
-
Number of large discount stores
- Judgement standardMany
- ImportanceLow
-
Number of supermarkets and convenience stores
- Judgement standardMany
- ImportanceLow
-
Number of public transportation facilities
- Judgement standardMany
- ImportanceMedium
-
Number of middle schools
- Judgement standardMany
- ImportanceHigh
-
Number of high schools
- Judgement standardMany
- ImportanceHigh
-
Number of private academic institutes
- Judgement standardMany
- ImportanceHigh
-
Air quality status (fine dust)
- Judgement standardGood
- ImportanceMedium
-
Air quality status (Carbon monoxide)
- Judgement standardGood
- ImportanceMedium
-
Urban park area per person
- Judgement standardWide
- ImportanceHigh
-
Share of apartments
- Judgement standardHigh
- ImportanceLow
-
Share of owner-occupied housing units
- Judgement standardHigh
- ImportanceMedium
-
Traffic accident safety
- Judgement standardGood
- ImportanceLow
-
Number of large discount stores
- Judgement standardMany
- ImportanceLow
-
Number of pet-related service establishments
- Judgement standardMany
- ImportanceHigh
-
Number of veterinary hospitals
- Judgement standardMany
- ImportanceHigh
-
Percentage of green space
- Judgement standardHigh
- ImportanceLow
-
Share of the elderly population
- Judgement standardHigh
- ImportanceHigh
-
Life safety
- Judgement standardGood
- ImportanceMedium
-
Number of convenience stores
- Judgement standardMany
- ImportanceMedium
-
Number of supermarkets and convenience stores
- Judgement standardMany
- ImportanceLow
-
Number of grocery stores
- Judgement standardMany
- ImportanceLow
-
Number of public transportation facilities
- Judgement standardMany
- ImportanceMedium
-
Number of clinics
- Judgement standardMany
- ImportanceHigh
-
Number of pharmacies
- Judgement standardMany
- ImportanceHigh
Selection of Nature indicators
-
Air quality status (fine dust)
Judgement standard
Importance
-
Air quality status (Carbon monoxide)
Judgement standard
Importance
-
Perceived temperature in summer
Judgement standard
Importance
-
Perceived temperature in winter
Judgement standard
Importance
-
Percentage of green space
Judgement standard
Importance
-
Urban park area per person
Judgement standard
Importance
Selection of Housing indicators
-
Share of apartments
Judgement standard
Importance
-
Share of row houses and apartment units in a private house
Judgement standard
Importance
-
Share of detached houses
Judgement standard
Importance
-
Residential area
Judgement standard
Importance
-
Share of old housing units
Judgement standard
Importance
-
Share of owner-occupied housing units
Judgement standard
Importance
-
Officially assessed land price
Judgement standard
Importance
-
Apartment price per area
Judgement standard
Importance
Selection of Population indicators indicators
-
Share of the young population
Judgement standard
Importance
-
Share of the youth and middle-aged population
Judgement standard
Importance
-
Share of the elderly population
Judgement standard
Importance
-
Share of one-person households
Judgement standard
Importance
-
Share of workers of establishments
Judgement standard
Importance
-
Net migration rate
Judgement standard
Importance
Selection of Safety indicators
Selection of Social infrastructure indicators
-
Number of convenience stores
Judgement standard
Importance
-
Number of department stores
Judgement standard
Importance
-
Number of large discount stores
Judgement standard
Importance
-
Number of supermarkets and convenience stores
Judgement standard
Importance
-
Number of grocery stores
Judgement standard
Importance
-
Number of restaurants
Judgement standard
Importance
-
Number of public transportation facilities
Judgement standard
Importance
-
Number of pet-related service establishments
Judgement standard
Importance
Selection of Education indicators
-
Number of elementary school students per class
Judgement standard
Importance
-
Number of middle school students per class
Judgement standard
Importance
-
Number of high school students per class
Judgement standard
Importance
-
Number of elementary schools
Judgement standard
Importance
-
Number of middle schools
Judgement standard
Importance
-
Number of high schools
Judgement standard
Importance
-
Number of private academic institutes
Judgement standard
Importance
Selection of Welfare and culture indicators
-
Number of kindergartens and childcare facilities
Judgement standard
Importance
-
Number of hospitals
Judgement standard
Importance
-
Number of clinics
Judgement standard
Importance
-
Number of pharmacies
Judgement standard
Importance
-
Number of veterinary hospitals
Judgement standard
Importance
-
Number of welfare facilities for the elderly
Judgement standard
Importance
-
Number of social welfare facilities
Judgement standard
Importance
-
Number of welfare facilities for the disabled
Judgement standard
Importance
-
Number of cultural facilities
Judgement standard
Importance
-
Number of sports facilities
Judgement standard
Importance
Selection of Nature Nature indicators
Selection of Nature Housing indicators
-
Share of apartments
Eup, Myeon & Dong -
Share of row houses and apartment units in a private house
Eup, Myeon & Dong -
Share of detached houses
Eup, Myeon & Dong -
Residential area
Eup, Myeon & Dong -
Share of old housing units
Eup, Myeon & Dong -
Share of owner-occupied housing units
Si, Gun & Gu -
Officially assessed land price
Eup, Myeon & Dong -
Apartment price per area
Eup, Myeon & Dong
Selection of Nature Population indicators indicators
Selection of Nature Social infrastructure indicators
-
Number of convenience stores
Eup, Myeon & Dong -
Number of department stores
Si, Gun & Gu -
Number of large discount stores
Eup, Myeon & Dong -
Number of supermarkets and convenience stores
Eup, Myeon & Dong -
Number of grocery stores
Eup, Myeon & Dong -
Number of restaurants
Eup, Myeon & Dong -
Number of public transportation facilities
Eup, Myeon & Dong -
Number of pet-related service establishments
Eup, Myeon & Dong
Selection of Nature Education indicators
-
Number of elementary school students per class
Eup, Myeon & Dong -
Number of middle school students per class
Eup, Myeon & Dong -
Number of high school students per class
Eup, Myeon & Dong -
Number of elementary schools
Eup, Myeon & Dong -
Number of middle schools
Eup, Myeon & Dong -
Number of high schools
Eup, Myeon & Dong -
Number of private academic institutes
Eup, Myeon & Dong
Selection of Nature Welfare and culture indicators
-
Number of kindergartens and childcare facilities
Eup, Myeon & Dong -
Number of hospitals
Si, Gun & Gu -
Number of clinics
Eup, Myeon & Dong -
Number of pharmacies
Eup, Myeon & Dong -
Number of veterinary hospitals
Eup, Myeon & Dong -
Number of welfare facilities for the elderly
Eup, Myeon & Dong -
Number of social welfare facilities
Eup, Myeon & Dong -
Number of welfare facilities for the disabled
Eup, Myeon & Dong -
Number of cultural facilities
Eup, Myeon & Dong -
Number of sports facilities
Eup, Myeon & Dong
Databoard
Databoard
Databoard
Selected regions and indicators are as follows:
(Unit : ㎡)
※Data level:- The nation9.14
- 강원도53.19
- 고성군9.14
(Unit : ㎡)
※Data level:- The nation9.14
- 강원도53.19
- 고성군9.14
(Unit : ㎡)
- The nation9.14
- 강원도53.19
- 고성군9.14
| Region(recommendation ranking) | Value |
|---|
- Recommended regions :
- 경기도 고양시 일산동구 장항2동 평균
- Comparison regions :
- 전국 평균
(Unit : ㎡)
※Data level:- The nation9.14
- 강원도53.19
- 고성군9.14
(Unit : ㎡)
※Data level:- The nation9.14
- 강원도53.19
- 고성군9.14
(Unit : ㎡)
- The nation9.14
- 강원도53.19
- 고성군9.14
| Region(recommendation ranking) | Value |
|---|
Databoard
Selected regions and indicators are as follows.
- Selected indicator
(Unit : ㎡)
- The nation9.14
- 강원도53.19
- 고성군9.14


