


대전 서구 둔산2동
Current location
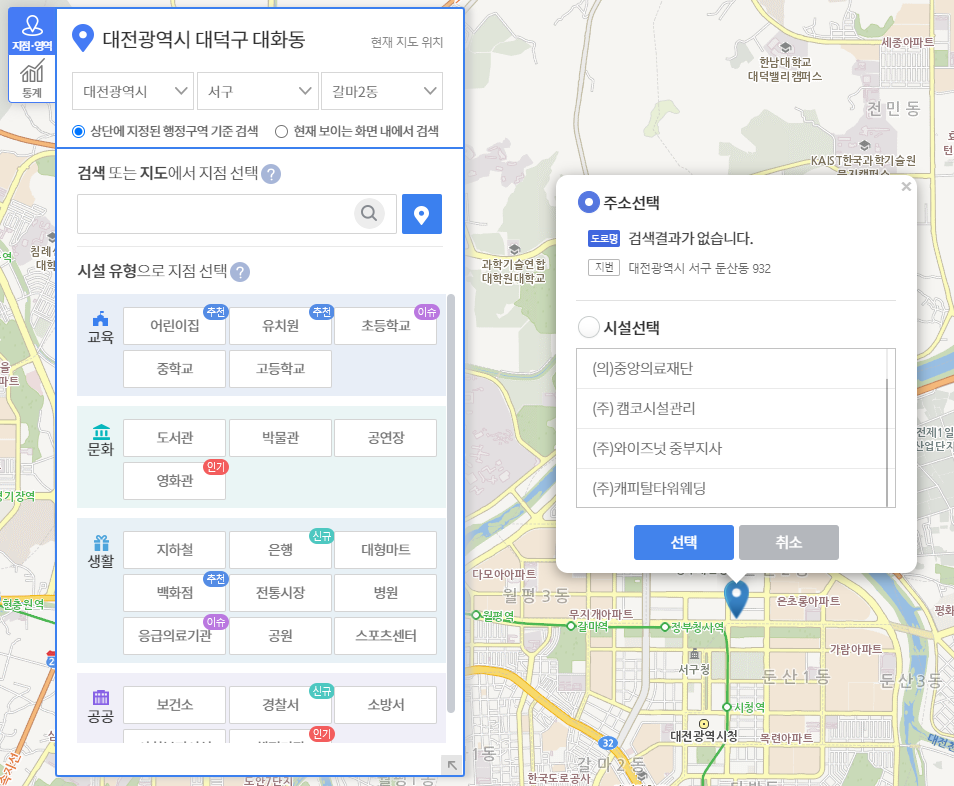
Select a location from the map


Select a location by facility type
Education

Culture

Life

Public

대전 서구 둔산동
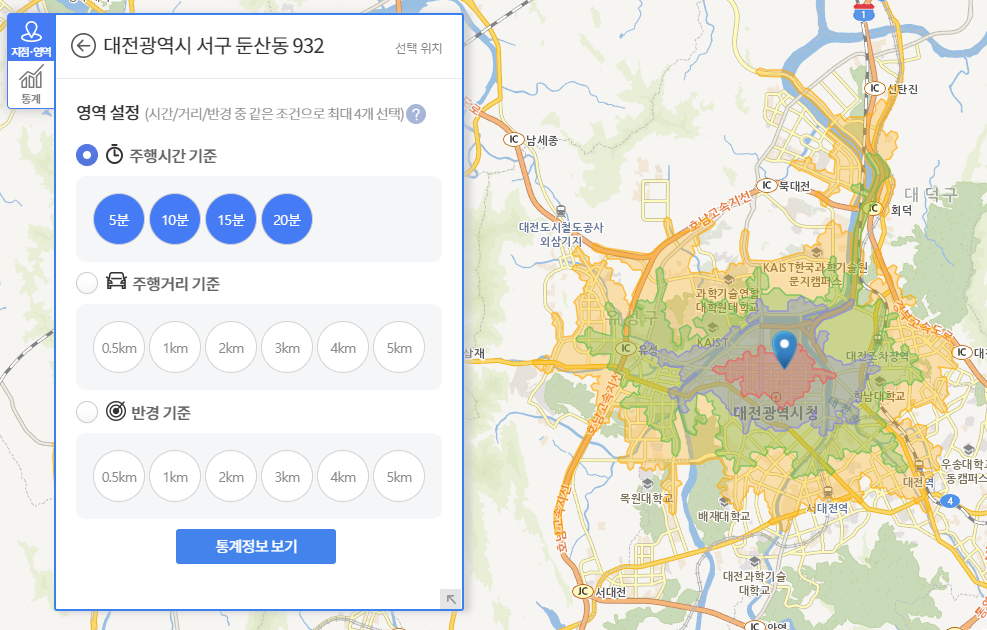
Selected locationArea setting
(Select a maximum of 4 areas per criterion among the options of time, distance and radius.)대전 서구 둔산동
Selected location영역 설정 기준
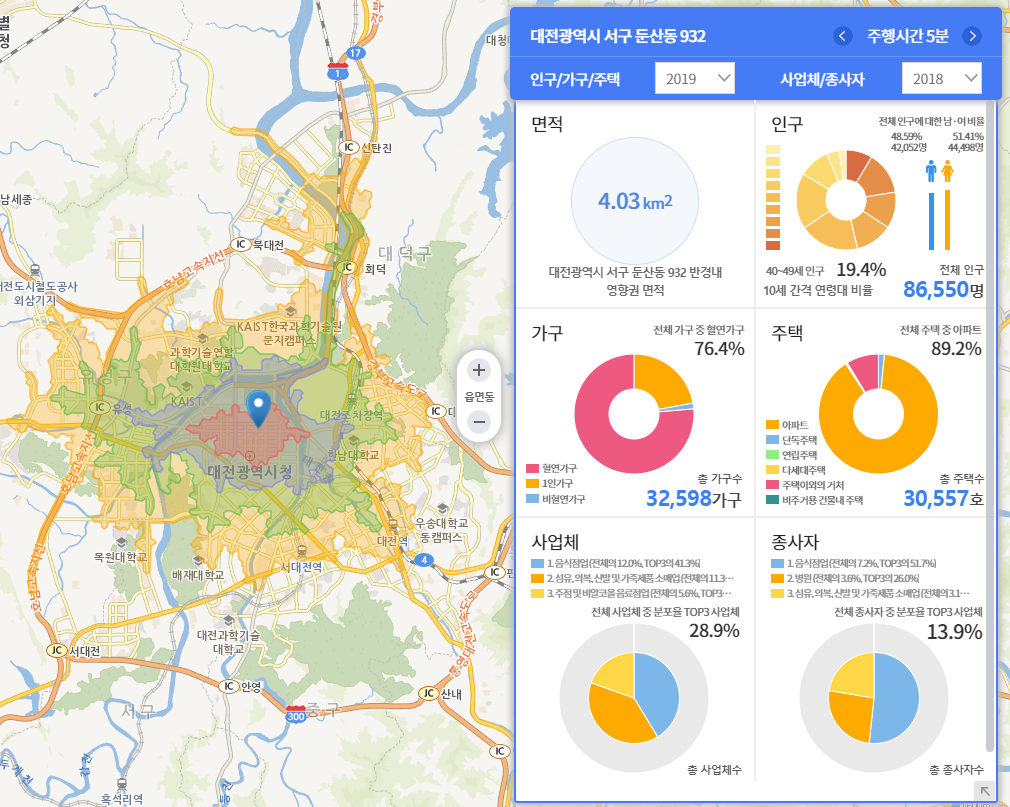
Total information for the area


- Population
- Household
-
Housing
Users can select only one criterion among housing type, construction year and total floor area.
-
Establishment
Data is provided using daily life industry categories, which are reclassified based on the Korean Standard Industry Classification to enhance user comprehension.
-
Worker
Data is provided using daily life industry categories, which are reclassified based on the Korean Standard Industry Classification to enhance user comprehension.
Gridded distribution (selection of only one option)
Grid-based statistics condition setting
-
Population
For grid sizes smaller than 1km, only the total value is provided.
-
Household
For grid sizes smaller than 1km, only the total value is provided.
-
Housing
For grid sizes smaller than 1km, only the total value is provided.
-
Establishment
For grid sizes smaller than 1km, only the total value is provided.
-
Worker
For grid sizes smaller than 1km, only the total value is provided.
- Population
- Household
-
Housing
Users can select only one criterion among housing type, construction year and total floor area.
-
Establishment
Users can view the total number of establishments.
Data is provided using daily life industry categories, which are reclassified based on the Korean Standard Industry Classification to enhance user comprehension. -
Worker
Users can view the total number of workers.
Data is provided using daily life industry categories, which are reclassified based on the Korean Standard Industry Classification to enhance user comprehension. - 공시지가
 위치1
위치1 연도1
연도1

검색 또는 지도에서 지점 선택
Select a location by facility type
나의 데이터로 지점 선택
나의 데이터 이동
상관관계 분석 조건 설정
통계 조건 선택 (최대 4개 종목선택)
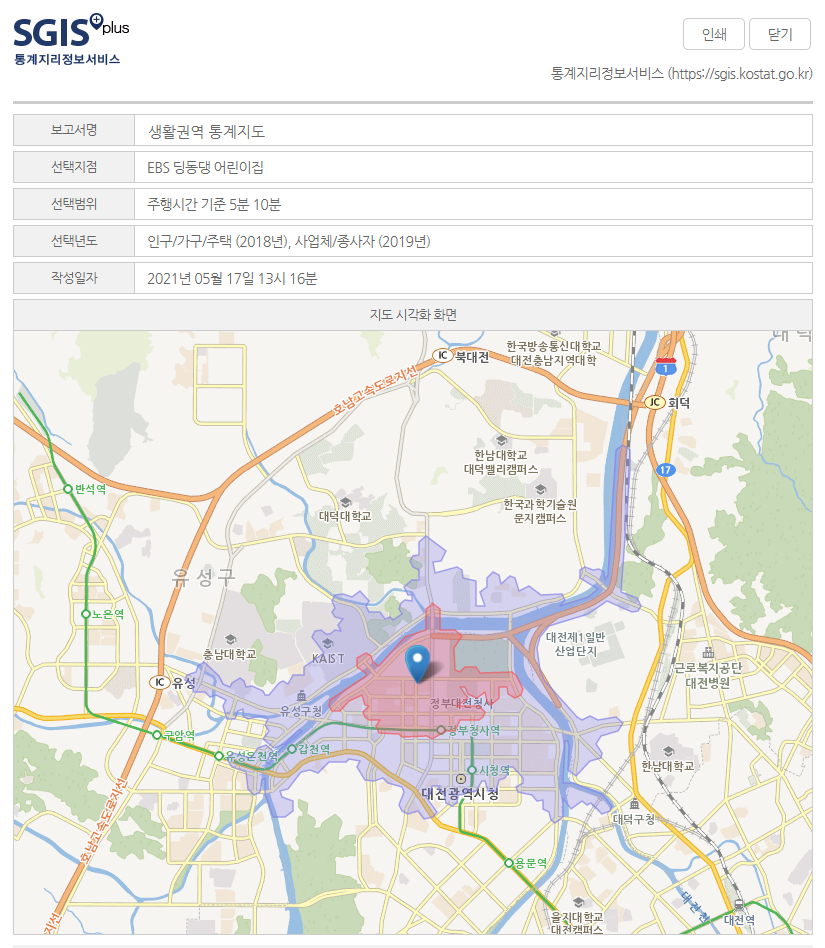
The 'Statistical Map of Living Area'
provides statistical information and grid*-based distributions for a specific facility or location by generating customized areas using driving time, driving distance or radius as criteria, regardless of administrative boundaries.
* Grid: A spatial unit defined by a network of vertical and horizontal lines intersecting at right angles, dividing the national territory irrespective of administrative boundaries
| ① Location Selection |
| Choose a pre-categorized facility type, search by location name or explore via the map. |
 |
→
| ② Area Generation |
| Generate areas using driving time, driving distance or radius as criteria. |
 |
→
| ③ Data Retrieval |
| View statistical data and grid-based distributions for the area |
 |
- This service presents aggregated data by assigning coordinates and attributes to location-based information from the Population and Housing Census and the Census on Establishments conducted by Statistics Korea. Records without identifiable location information (e.g., national security facilities, individual taxi businesses, etc.) are not included.
- Therefore, this service should be used only for the purpose of obtaining approximate statistical data and grid-based distributions within the selected area.
한국표준산업분류 내용보기
| 순번 | 분류코드 | 분류항목명 |
|---|---|---|
| 검색한 자료가 없습니다. | ||
| 분류내용보기 | |||
|---|---|---|---|
| 차수 | 분류코드 | ||
| 분류명 | |||
| 설명 | |||
| 색인어 | |||

-
Area
 360,000㎢
-
Population
100%
10,000person


100%
10,000person
Proportion of males and females in the total population
10세 간격 연령대 비율
전체 인구 중
Others Selected conditionTotal population
persons
The statistical value of the population for the area is '0'. -
Household
전체 가구 중
Others Selected conditionTotal number of households
households
The statistical value of the households for the area is '0'. -
Housing
- Detached house
- Apartment
- Row house
- Apartment unit in a private house
- House within a commercial building
전체 주택 중
Others Selected conditionTotal number of housing units
units
The statistical value of the housing units for the area is '0'. -
Establishment
- 한식 일반 음식점 (전체의 18.7%, TOP3의 42.4%)
- 커피전문점식점 (전체의 14.7%, TOP3의 31.4%)
- 한식 일반 음식점 (전체의 11.7%, TOP3의 26.4%)
전체 사업체 중
- Selected condition
- Others
Total number of establishments
establishments
The statistical value of the establishments for the area is '0'. -
Worker
- 한식 일반 음식점 (전체의 18.7%, TOP3의 42.4%)
- 커피전문점식점 (전체의 14.7%, TOP3의 31.4%)
- 한식 일반 음식점 (전체의 11.7%, TOP3의 26.4%)
전체 종사자 중
- Selected condition
- Others
Total number of workers
persons
The statistical value of the workers for the area is '0'.
Grid-based statistical information
Grid size100m x100m
Number of grids within the area38,400
Total grid area36,840,000 ㎢
Administrative district
경기도 수원시 팔달구,영통구,장안구Population of all areas based on 1km grids
(성별전체, 연령전체)

:
Selected condition :
- Empty grid
- Empty grid
The population of the selected grid area
(성별전체, 연령전체)
:
Legend of the selected grid area
Name of the selected grid area
Grid-based statistical information
영역 전체 격자 및 통계정보 위치1: 대전광역시 서구 도안동 14
Grid size100m x100m
영역 내 격자 개수38,400
총 격자 면적36,840,000m ㎢
행정구역
경기도 수원시 팔달구,영통구,장안구
영역 전체 100m 격자 기반 인구 수
[(성별전체, 연령전체) 인구수]
: 348,800
위치2: 대전광역시 서구 도안동 14
Grid size100m x100m
영역 내 격자 개수38,400
총 격자 면적36,840,000 ㎢
행정구역
경기도 수원시 팔달구,영통구,장안구
영역 전체 100m 격자 기반 인구 수
[(성별전체, 연령전체) 인구수]
: 348,800
범례 및 분포현황
- 빈격자
- 빈격자
Statistical values provided in the 'Statistical Map of Living Area' are based on basic data for the area to which the BSCA (Bounded Small Cell Adjustment) technique is applied. The data should be interpreted as shown in the following examples.
- Population / household / housing
| Value in the 'Statistical Map of Living Area' | Actual value |
|---|---|
| 0 | One of 0, 1, 2, 3 or 4 |
| 5 | One of 1, 2, 3, 4 or 5 |
| Value M of 6 or more | One of M-2 ~ M+2 (M-7 ~ M+7 for some statistics)* |
| (e.g.) The value '200' in the population data of the 'Statistical Map of Living Area' represents an actual value between 198 and 202. | |
- Establishment / Worker
| Value in the 'Statistical Map of Living Area' | Actual value |
|---|---|
| 0 | One of 0, 1 or 2 |
| 3 | One of 1, 2 or 3 |
| Value N of 4 or more | One of N-1, N pr N+1 (N-4 ~ N+4 for some statistics)* |
| (e.g.) The value '200' in the establishment data of the 'Statistical Map of Living Area' represents an actual value between 199 and 201. | |
* This data processing step was added to help users interpret statistical information at smaller units. While it may increase the gap from the actual values, this process is essential for statistical disclosure control and protecting data privacy.